Gabriel India: Ascending Trendline Breakout, Chart of the Week
Price Action Analysis:
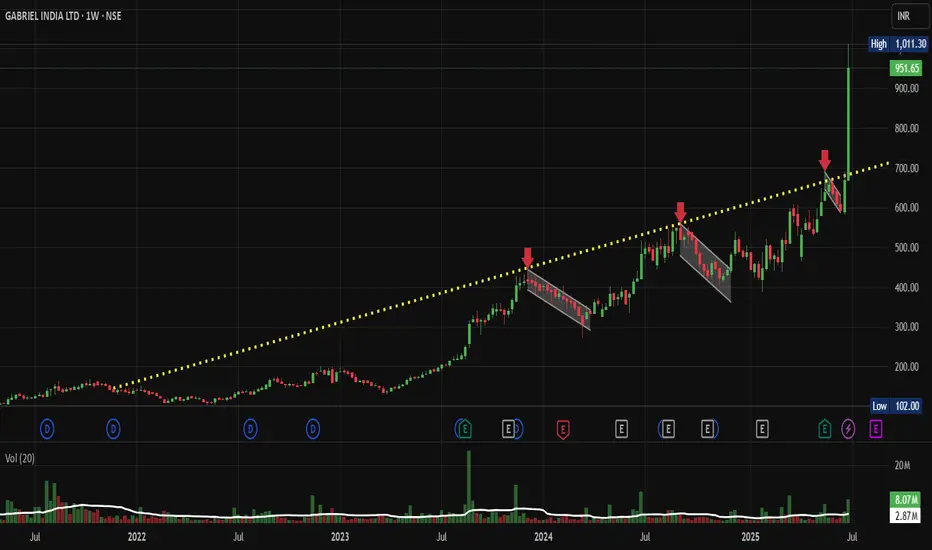
• The stock has shown a remarkable multi-year uptrend from around ₹100 levels in 2022 to current levels above ₹950
• A clear ascending channel pattern is visible with the yellow dotted trendline acting as dynamic support
• Recent price action shows a powerful breakout from a consolidation phase around ₹600-700 levels
• The stock is currently trading near all-time highs with strong momentum
• Volume expansion during the recent breakout confirms genuine buying interest
Volume Spread Analysis:
• Volume patterns show significant spikes during major price advances
• The recent breakout phase is accompanied by above-average volume, indicating institutional participation
• Volume tends to contract during consolidation phases, which is a healthy price action
• The volume profile suggests strong accumulation during the base-building phases
Key Technical Levels:
Base Formation:
• Primary base formed between ₹100-200 levels during 2022-early 2023
• Secondary base established around ₹400-500 levels in late 2023
• Most recent consolidation base around ₹600-700 levels before the current breakout
Support Levels:
• Immediate support: ₹850-900 (recent breakout zone)
• Strong support: ₹700-750 (previous resistance turned support)
• Major support: ₹600 (base of recent consolidation)
• Critical support: ₹500 (psychological level and previous consolidation zone)
Resistance Levels:
• Immediate resistance: ₹1000-1050 (psychological barrier)
• Next resistance: ₹1200 (measured move target)
• Extended target: ₹1400-1500 (based on channel projection)
Technical Pattern Recognition:
Primary Patterns:
• Long-term ascending channel with consistent higher highs and higher lows
• Multiple cups and handle formations during the uptrend
• Recent flag/pennant consolidation followed by breakout
• Classical stage 2 uptrend characteristics with expanding volume
Technical Indicators:
• Price trading above all major moving averages
• Strong momentum as evidenced by the steep price advance
• Healthy pullbacks followed by resumption of uptrend
• Volume-price confirmation during breakouts
Trade Setup:
Entry Levels:
• Aggressive entry: Current market price (₹950-970)
• Conservative entry: On pullback to ₹850-880 levels
• Breakout entry: Above ₹1000 with volume confirmation
• Accumulation entry: Any dip towards ₹800-820 levels
Exit Levels:
• First target: ₹1200 (26% upside from current levels)
• Second target: ₹1400 (47% upside)
• Extended target: ₹1600 (68% upside)
• Trailing stop strategy recommended for long-term positions
Stop-Loss Placement:
• For aggressive entries: ₹800 (16% risk)
• For conservative entries: ₹750 (12% risk from ₹850 entry)
• For breakout entries: ₹900 (10% risk from ₹1000 entry)
• Weekly closing basis stop-loss recommended
Risk Management Framework:
Position Sizing:
• Risk per trade: Maximum 2-3% of portfolio
• For ₹800 stop-loss from current price: Position size = (Portfolio × 2%) ÷ ₹150
• Recommended allocation: 5-8% of equity portfolio given the risk-reward profile
• Consider scaling into position over 2-3 tranches
Risk Parameters:
• Maximum drawdown tolerance: 20% from peak
• Time-based stop: Exit if consolidation exceeds 6 months
• Sector rotation risk: Monitor auto sector performance
• Market correlation: High beta stock, reduce position size in volatile markets
Sectoral Backdrop:
Auto Ancillary Sector Dynamics:
• Indian automotive sector showing strong recovery post-COVID
• Shift towards electric vehicles creating new opportunities for component manufacturers
• Export potential increasing with global supply chain diversification
• Government's PLI scheme supporting auto component manufacturing
Industry Trends:
• Increasing focus on high-quality, precision components
• Growing aftermarket business providing stable revenue streams
• Consolidation in the sector is favouring established players
• Technology upgrades driving margin expansion
Fundamental Backdrop:
Company Overview:
•
• Strong presence in both OEM and aftermarket segments
• Diversified customer base across passenger vehicles, commercial vehicles, and two-wheelers
• Established relationships with major automotive manufacturers
Financial Highlights:
• Consistent revenue growth is driven by industry expansion
• Improving margins through operational efficiency and product mix optimization
• Strong balance sheet with manageable debt levels
• Increasing return on equity and return on capital employed
Growth Drivers:
• Expanding automotive production in India
• Growing replacement market for suspension components
• Export opportunities in emerging markets
• New product development and technology partnerships
Investment Thesis:
• Well-positioned to benefit from India's automotive growth story
• Strong competitive moat through technical expertise and customer relationships
• Potential for multiple expansions as the company scales operations
• Dividend yield providing downside protection for long-term investors
My Take:
The technical setup for
Keep in the Watchlist.
NO RECO. For Buy/Sell.
📌Thank you for exploring my idea! I hope you found it valuable.
🙏FOLLOW for more
👍BOOST if you found it useful.
✍️COMMENT below with your views.
Meanwhile, check out my other stock ideas on the right side until this trade is activated. I would love your feedback.
Disclaimer: "I am not a SEBI REGISTERED RESEARCH ANALYST AND INVESTMENT ADVISER."
This analysis is intended solely for informational and educational purposes and should not be interpreted as financial advice. It is advisable to consult a qualified financial advisor or conduct thorough research before making investment decisions.
Dagangan aktif
Breakout entry: Above ₹1000 Active nowNota
Immediate resistance: ₹1000-1050 (psychological barrier) Breached ConvincinglyPenerbitan berkaitan
Penafian
Maklumat dan penerbitan adalah tidak dimaksudkan untuk menjadi, dan tidak membentuk, nasihat untuk kewangan, pelaburan, perdagangan dan jenis-jenis lain atau cadangan yang dibekalkan atau disahkan oleh TradingView. Baca dengan lebih lanjut di Terma Penggunaan.
Penerbitan berkaitan
Penafian
Maklumat dan penerbitan adalah tidak dimaksudkan untuk menjadi, dan tidak membentuk, nasihat untuk kewangan, pelaburan, perdagangan dan jenis-jenis lain atau cadangan yang dibekalkan atau disahkan oleh TradingView. Baca dengan lebih lanjut di Terma Penggunaan.