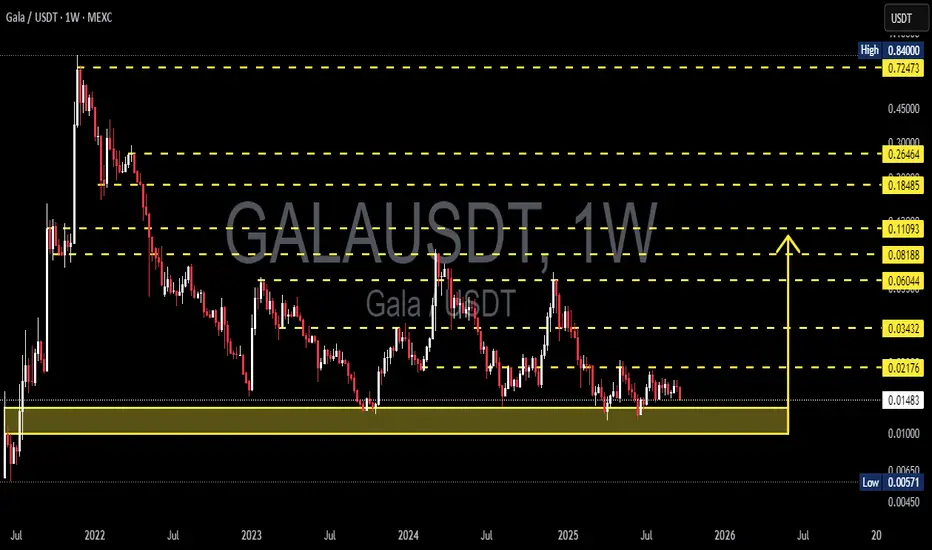
GALA has been in a long-term downtrend since 2021, with heavy selling pressure pushing the price into a prolonged bottoming phase. However, one thing stands out: despite repeated tests, price continues to hold the strong demand zone between 0.0057 – 0.012 USDT. This zone has become the “last fortress” for GALA.
---
🔎 Technical Structure & Pattern
Primary trend: Long-term bearish, consistently forming lower highs since the 2021 peak.
Current phase: Sideways / accumulation above the demand zone. This can either signal early accumulation for a rebound or final distribution before a breakdown.
Key levels:
Support: 0.012 – 0.0057 (major demand zone).
Resistances to watch: 0.02176 → 0.03432 → 0.06044 → 0.08188 → 0.11093 → 0.18485 → 0.26464 → 0.72473.
---
🟢 Bullish Scenario
1. Confirmation: A weekly close above 0.02176 would be the first sign of strength.
2. Targets: 0.03432 → 0.06044 → 0.08188. Strong momentum could extend toward 0.11 – 0.18 in the medium term.
3. Upside potential: From the current price (~0.01495), a move to 0.03432 = +129%, to 0.06044 = +304%.
4. Bullish catalysts:
Overall crypto market recovery (BTC rally).
Strong updates from GALA Games ecosystem.
Rising volume indicating smart money inflows.
---
🔴 Bearish Scenario
1. Confirmation: Weekly close below 0.012 → demand zone fails.
2. Downside target: Retest of 0.0057 (≈ −62% from current price).
3. Further risk: A breakdown below 0.0057 could send GALA into new price discovery to the downside.
4. Bearish catalysts:
Market-wide weakness (BTC breakdown).
Thin liquidity around support zones.
Weakening sentiment in the gaming/NFT sector.
---
📌 Key Takeaway
GALA is at a crossroads:
Holding above 0.012 and breaking 0.0217 could ignite a recovery rally.
Losing 0.012 exposes the price to a deeper fall toward 0.0057.
The shrinking volatility on the weekly chart suggests a major move may be imminent.
---
🎯 Conclusion
GALA’s weekly chart is testing investor patience. Holding the demand zone could spark a powerful upside, but losing it risks a deeper slide to historical lows. The next weekly candles will be decisive for GALA’s mid-term direction.
---
#GALA #GALAUSDT #CryptoAnalysis #Altcoins #PriceAction #WeeklyChart #CryptoGaming
---
🔎 Technical Structure & Pattern
Primary trend: Long-term bearish, consistently forming lower highs since the 2021 peak.
Current phase: Sideways / accumulation above the demand zone. This can either signal early accumulation for a rebound or final distribution before a breakdown.
Key levels:
Support: 0.012 – 0.0057 (major demand zone).
Resistances to watch: 0.02176 → 0.03432 → 0.06044 → 0.08188 → 0.11093 → 0.18485 → 0.26464 → 0.72473.
---
🟢 Bullish Scenario
1. Confirmation: A weekly close above 0.02176 would be the first sign of strength.
2. Targets: 0.03432 → 0.06044 → 0.08188. Strong momentum could extend toward 0.11 – 0.18 in the medium term.
3. Upside potential: From the current price (~0.01495), a move to 0.03432 = +129%, to 0.06044 = +304%.
4. Bullish catalysts:
Overall crypto market recovery (BTC rally).
Strong updates from GALA Games ecosystem.
Rising volume indicating smart money inflows.
---
🔴 Bearish Scenario
1. Confirmation: Weekly close below 0.012 → demand zone fails.
2. Downside target: Retest of 0.0057 (≈ −62% from current price).
3. Further risk: A breakdown below 0.0057 could send GALA into new price discovery to the downside.
4. Bearish catalysts:
Market-wide weakness (BTC breakdown).
Thin liquidity around support zones.
Weakening sentiment in the gaming/NFT sector.
---
📌 Key Takeaway
GALA is at a crossroads:
Holding above 0.012 and breaking 0.0217 could ignite a recovery rally.
Losing 0.012 exposes the price to a deeper fall toward 0.0057.
The shrinking volatility on the weekly chart suggests a major move may be imminent.
---
🎯 Conclusion
GALA’s weekly chart is testing investor patience. Holding the demand zone could spark a powerful upside, but losing it risks a deeper slide to historical lows. The next weekly candles will be decisive for GALA’s mid-term direction.
---
#GALA #GALAUSDT #CryptoAnalysis #Altcoins #PriceAction #WeeklyChart #CryptoGaming
✅ Get Free Signals! Join Our Telegram Channel Here: t.me/TheCryptoNuclear
✅ Twitter: twitter.com/crypto_nuclear
✅ Join Bybit : partner.bybit.com/b/nuclearvip
✅ Benefits : Lifetime Trading Fee Discount -50%
✅ Twitter: twitter.com/crypto_nuclear
✅ Join Bybit : partner.bybit.com/b/nuclearvip
✅ Benefits : Lifetime Trading Fee Discount -50%
Penafian
Maklumat dan penerbitan adalah tidak bertujuan, dan tidak membentuk, nasihat atau cadangan kewangan, pelaburan, dagangan atau jenis lain yang diberikan atau disahkan oleh TradingView. Baca lebih dalam Terma Penggunaan.