Glenmark Pharma (NSE: GLENMARK) – Professional Chart Analysis, Price Path & Trading Advice (educational)
Market structure and thesis
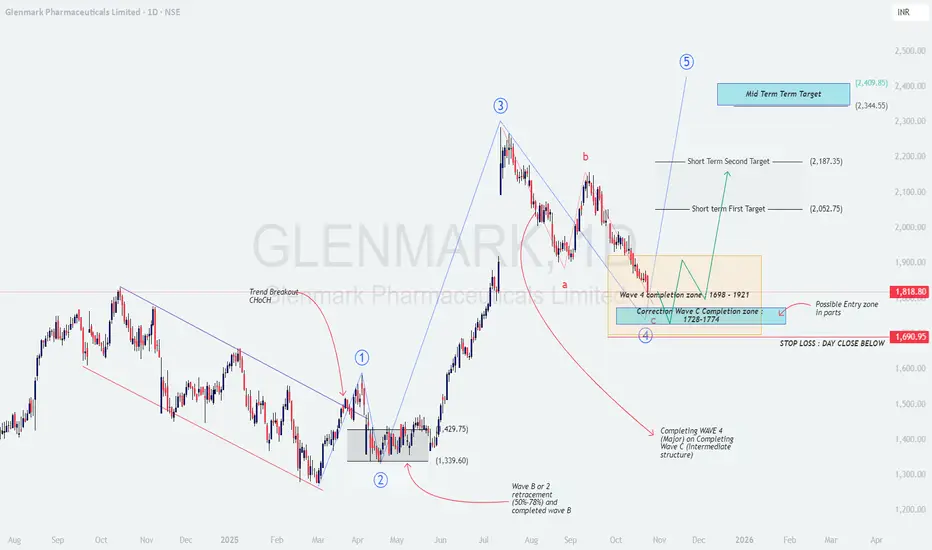
The chart shows a completed impulsive advance into Wave 3, followed by a corrective a‑b‑c decline progressing into the Wave‑4 completion zone 1,698–1,921 that overlaps with a deeper Wave‑C completion band 1,728–1,774. This clustering of supports, plus a prior change‑of‑character (ChoCH) earlier in the cycle, suggests the correction is maturing and a new advancing leg is probable if price holds above the invalidation.
Candles in the box are showing decelerating downside and overlapping ranges, consistent with late‑stage corrective behavior; a higher low inside 1,74x–1,82x followed by a break of recent swing supply would confirm a trend inflection toward Wave‑5 projections.
Key levels to watch
Demand zones: 1,728–1,774 (C completion), 1,698–1,921 (Wave‑4 box).
Trigger levels: Reclaim and daily close above 1,880–1,900 improves odds; a stronger confirmation is a close above 1,940–1,960 (box top/supply shelf).
Invalidation: Day close below ~1,691 cancels the bullish swing setup and opens risk to lower retracements.
Price movement prediction
Base case (probability favored): Stabilization above 1,74x–1,82x → break and hold above 1,900 → push to Short‑Term T1 ≈ 2,053, then Short‑Term T2 ≈ 2,187 as supply pockets get cleared. Sustained momentum and broader sector tailwinds can extend toward a mid‑term Wave‑5 objective 2,345–2,410.
Alternate (bearish): Failure to hold 1,74x–1,80x with a daily close below 1,691 shifts bias to distribution; expect a slide to prior swing supports before a fresh base is attempted. In this path, avoid bottom‑fishing and wait for a new ChoCH and higher‑low structure.
Trade plan ideas
Market structure and thesis
The chart shows a completed impulsive advance into Wave 3, followed by a corrective a‑b‑c decline progressing into the Wave‑4 completion zone 1,698–1,921 that overlaps with a deeper Wave‑C completion band 1,728–1,774. This clustering of supports, plus a prior change‑of‑character (ChoCH) earlier in the cycle, suggests the correction is maturing and a new advancing leg is probable if price holds above the invalidation.
Candles in the box are showing decelerating downside and overlapping ranges, consistent with late‑stage corrective behavior; a higher low inside 1,74x–1,82x followed by a break of recent swing supply would confirm a trend inflection toward Wave‑5 projections.
Key levels to watch
Demand zones: 1,728–1,774 (C completion), 1,698–1,921 (Wave‑4 box).
Trigger levels: Reclaim and daily close above 1,880–1,900 improves odds; a stronger confirmation is a close above 1,940–1,960 (box top/supply shelf).
Invalidation: Day close below ~1,691 cancels the bullish swing setup and opens risk to lower retracements.
Price movement prediction
Base case (probability favored): Stabilization above 1,74x–1,82x → break and hold above 1,900 → push to Short‑Term T1 ≈ 2,053, then Short‑Term T2 ≈ 2,187 as supply pockets get cleared. Sustained momentum and broader sector tailwinds can extend toward a mid‑term Wave‑5 objective 2,345–2,410.
Alternate (bearish): Failure to hold 1,74x–1,80x with a daily close below 1,691 shifts bias to distribution; expect a slide to prior swing supports before a fresh base is attempted. In this path, avoid bottom‑fishing and wait for a new ChoCH and higher‑low structure.
Trade plan ideas
- Accumulate in parts: Stagger entries 1,74x–1,82x with a core risk defined by a day‑close stop below 1,691.
Confirmation add: Add on daily close above 1,900–1,920 and again above 1,940–1,960 if volume expands.
Profit taking: Scale 30–40% near 2,05x, another tranche around 2,18x; trail the remainder with a daily/weekly higher‑low stop for a potential run toward 2,35x–2,41x.
[/list=1]
Logic and validation checklist
Confluence: Wave‑4 price box overlaps Wave‑C termination band → strong probability of correction end if defended.
Structure: Need a higher low plus break/retest of 1,90x–1,96x to confirm demand dominance.
Momentum: Look for improving RSI/MACD and rising green‑day volume on pushes through supply.
Disclaimer: This post is for education only and not investment advice or a solicitation to buy/sell securities; I am not a SEBI registered analyst.
Penafian
Maklumat dan penerbitan adalah tidak dimaksudkan untuk menjadi, dan tidak membentuk, nasihat untuk kewangan, pelaburan, perdagangan dan jenis-jenis lain atau cadangan yang dibekalkan atau disahkan oleh TradingView. Baca dengan lebih lanjut di Terma Penggunaan.
Penafian
Maklumat dan penerbitan adalah tidak dimaksudkan untuk menjadi, dan tidak membentuk, nasihat untuk kewangan, pelaburan, perdagangan dan jenis-jenis lain atau cadangan yang dibekalkan atau disahkan oleh TradingView. Baca dengan lebih lanjut di Terma Penggunaan.