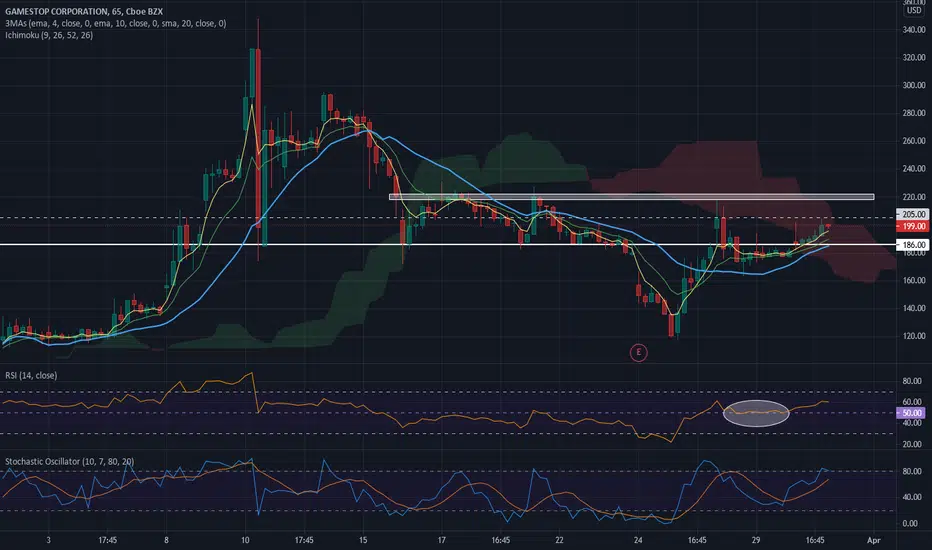
Shown on the 65m chart, RSI crossed over 50, came back to test it twice, and gradually moved higher. Normally this "double dip" test plus a trade above the signal candle results in a strong move higher. In this case GME could move to 218-220 (white bar) to complete an inverse head & shoulder pattern, but first price has to get over 205 (dashed line).
On the daily chart there is a long bullish engulfing candle off the 50sma, which corresponds to RSI dipping below 50 and crossing back over. The 26 March candle triggered long with a trade higher than the signal candle (25 March). Price action seems to be taking a pause after last week's move up from 120.
A close over 26th open, 197.68, creates a nice 3-candle pattern with price closing back over 20sma. Candle patterns add strength (or caution) to other indicators; I do not use them as stand alone indicators.
Penafian
Maklumat dan penerbitan adalah tidak dimaksudkan untuk menjadi, dan tidak membentuk, nasihat untuk kewangan, pelaburan, perdagangan dan jenis-jenis lain atau cadangan yang dibekalkan atau disahkan oleh TradingView. Baca dengan lebih lanjut di Terma Penggunaan.
Penafian
Maklumat dan penerbitan adalah tidak dimaksudkan untuk menjadi, dan tidak membentuk, nasihat untuk kewangan, pelaburan, perdagangan dan jenis-jenis lain atau cadangan yang dibekalkan atau disahkan oleh TradingView. Baca dengan lebih lanjut di Terma Penggunaan.