XAUUISD: Market Analysis and Strategy for December 1st
Gold Technical Analysis:
Daily Resistance: 4330, Support: 4150
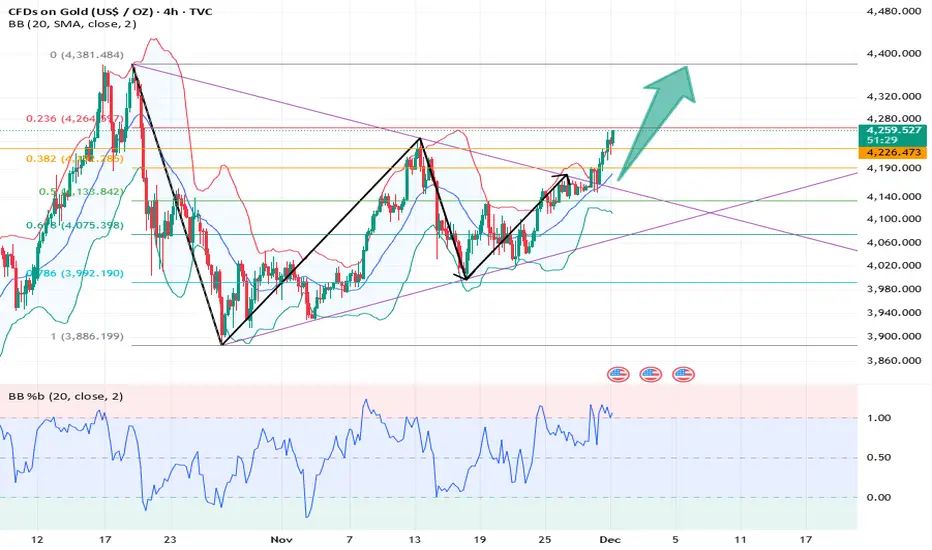
4-Hour Resistance: 4265, Support: 4193
1-Hour Resistance: 4256, Support: 4226
The monthly chart's renewed upward movement reinforces the continuation of this year's bull market. Last Friday's strong rally indicates that the short-term upward trend has not been hindered, further strengthening bullish expectations for early December.
The daily chart continues last Friday's upward trend, with the "rounded bottom" candlestick pattern remaining intact. The Asian session also saw a strong upward breakout, with the Bollinger Bands expanding upwards, moving average support moving higher, and the MACD/KDJ indicators turning upwards. Today's accelerated breakout above previous highs is also a bullish signal. Short-term trading should follow the trend! Long-term holders can wait for the Fed's interest rate decision before considering buying opportunities!
Based on the 1-hour chart, gold continued its upward trend during the European session. The candlestick pattern is within an upward channel, and the short-term Bollinger Bands are narrowing upwards. Be aware of potential sideways consolidation followed by a rebound after indicator correction. Resistance is seen around 4260; a break above this level could lead to further gains towards 4300/4330. Support levels are around 4230/4222.
Trading Strategy:
BUY: 4230~4222
Selling should wait for a bearish pattern to emerge in real-time.
Daily Resistance: 4330, Support: 4150
4-Hour Resistance: 4265, Support: 4193
1-Hour Resistance: 4256, Support: 4226
The monthly chart's renewed upward movement reinforces the continuation of this year's bull market. Last Friday's strong rally indicates that the short-term upward trend has not been hindered, further strengthening bullish expectations for early December.
The daily chart continues last Friday's upward trend, with the "rounded bottom" candlestick pattern remaining intact. The Asian session also saw a strong upward breakout, with the Bollinger Bands expanding upwards, moving average support moving higher, and the MACD/KDJ indicators turning upwards. Today's accelerated breakout above previous highs is also a bullish signal. Short-term trading should follow the trend! Long-term holders can wait for the Fed's interest rate decision before considering buying opportunities!
Based on the 1-hour chart, gold continued its upward trend during the European session. The candlestick pattern is within an upward channel, and the short-term Bollinger Bands are narrowing upwards. Be aware of potential sideways consolidation followed by a rebound after indicator correction. Resistance is seen around 4260; a break above this level could lead to further gains towards 4300/4330. Support levels are around 4230/4222.
Trading Strategy:
BUY: 4230~4222
Selling should wait for a bearish pattern to emerge in real-time.
Dagangan aktif
The price has reacted to the short-term support level of 4222-4230 and has rebounded by $17.💥Telegram Channel Free Updates 👉🏻
💥This a place for learning and communication. 👉🏻
💥Provide trading guidance.👉🏻
Telegram Channel👉🏻t.me/Actuary00group
💥This a place for learning and communication. 👉🏻
💥Provide trading guidance.👉🏻
Telegram Channel👉🏻t.me/Actuary00group
Penafian
Maklumat dan penerbitan adalah tidak bertujuan, dan tidak membentuk, nasihat atau cadangan kewangan, pelaburan, dagangan atau jenis lain yang diberikan atau disahkan oleh TradingView. Baca lebih dalam Terma Penggunaan.
💥Telegram Channel Free Updates 👉🏻
💥This a place for learning and communication. 👉🏻
💥Provide trading guidance.👉🏻
Telegram Channel👉🏻t.me/Actuary00group
💥This a place for learning and communication. 👉🏻
💥Provide trading guidance.👉🏻
Telegram Channel👉🏻t.me/Actuary00group
Penafian
Maklumat dan penerbitan adalah tidak bertujuan, dan tidak membentuk, nasihat atau cadangan kewangan, pelaburan, dagangan atau jenis lain yang diberikan atau disahkan oleh TradingView. Baca lebih dalam Terma Penggunaan.