"Gold Price Analysis: Will the Bull Run Continue?"
Technical Analysis of XAUUSD
1. Current Market Structure
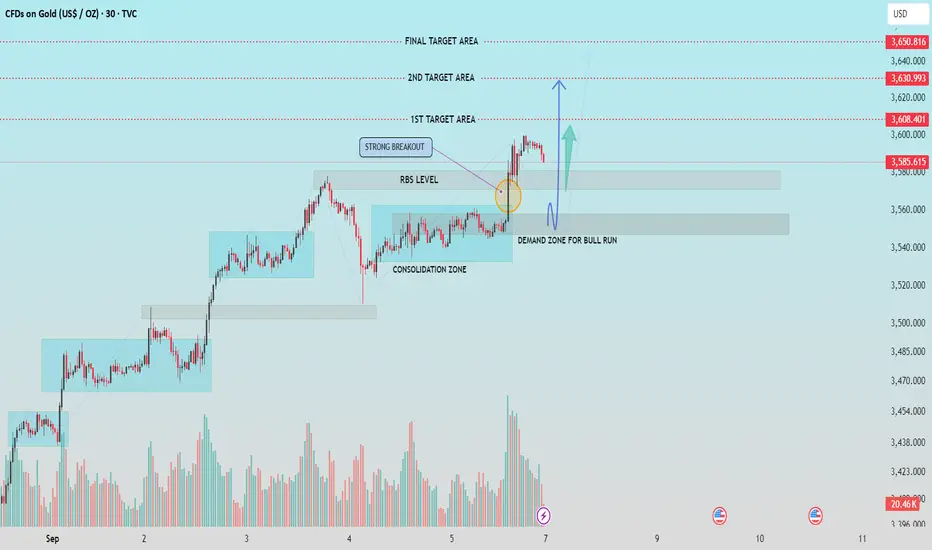
Gold is currently in a strong uptrend, forming a series of Higher Highs (HH) and Higher Lows (HL). This shows consistent bullish momentum after breaking consolidation phases.
2. Key Breakout Point
A strong breakout occurred from the consolidation zone, followed by a pullback toward the RBS (Resistance Becomes Support) level. This confirms buyers are still active in the market.
3. Demand Zone for Bull Run
The demand zone lies around 3,560 – 3,575, which is a strong support area. Price is expected to retest this zone before resuming the bullish move.
4. Short-Term Price Action
If price holds above the demand zone and forms bullish confirmation (like bullish engulfing or strong rejection), a continuation to the upside is highly probable.
5. Target Areas
1st Target: Around 3,608
2nd Target: Around 3,631
Final Target: Around 3,651
These levels align with previous resistance zones and Fibonacci extensions.
6. Bullish Bias
As long as price remains above the demand zone and does not break below 3,550, the market outlook remains bullish for continuation.
Support me, For More Insightful Analysis.
1. Current Market Structure
Gold is currently in a strong uptrend, forming a series of Higher Highs (HH) and Higher Lows (HL). This shows consistent bullish momentum after breaking consolidation phases.
2. Key Breakout Point
A strong breakout occurred from the consolidation zone, followed by a pullback toward the RBS (Resistance Becomes Support) level. This confirms buyers are still active in the market.
3. Demand Zone for Bull Run
The demand zone lies around 3,560 – 3,575, which is a strong support area. Price is expected to retest this zone before resuming the bullish move.
4. Short-Term Price Action
If price holds above the demand zone and forms bullish confirmation (like bullish engulfing or strong rejection), a continuation to the upside is highly probable.
5. Target Areas
1st Target: Around 3,608
2nd Target: Around 3,631
Final Target: Around 3,651
These levels align with previous resistance zones and Fibonacci extensions.
6. Bullish Bias
As long as price remains above the demand zone and does not break below 3,550, the market outlook remains bullish for continuation.
Support me, For More Insightful Analysis.
Dagangan aktif
from RBS level , 3582, Nota
Dagangan ditutup: sasaran tercapai
💸FREE FOREX Signals in Telegram : t.me/FxInsightsHub0
🔹Join Our Telegram Channel, Pure Price Action Based Signals With Chart Analysis.
t.me/FxInsightsHub0
🚀FREE CRYPTO Signals In Telegram: t.me/FxInsightsHub0
🔹Join Our Telegram Channel, Pure Price Action Based Signals With Chart Analysis.
t.me/FxInsightsHub0
🚀FREE CRYPTO Signals In Telegram: t.me/FxInsightsHub0
Penerbitan berkaitan
Penafian
Maklumat dan penerbitan adalah tidak dimaksudkan untuk menjadi, dan tidak membentuk, nasihat untuk kewangan, pelaburan, perdagangan dan jenis-jenis lain atau cadangan yang dibekalkan atau disahkan oleh TradingView. Baca dengan lebih lanjut di Terma Penggunaan.