Gold 4H Analysis
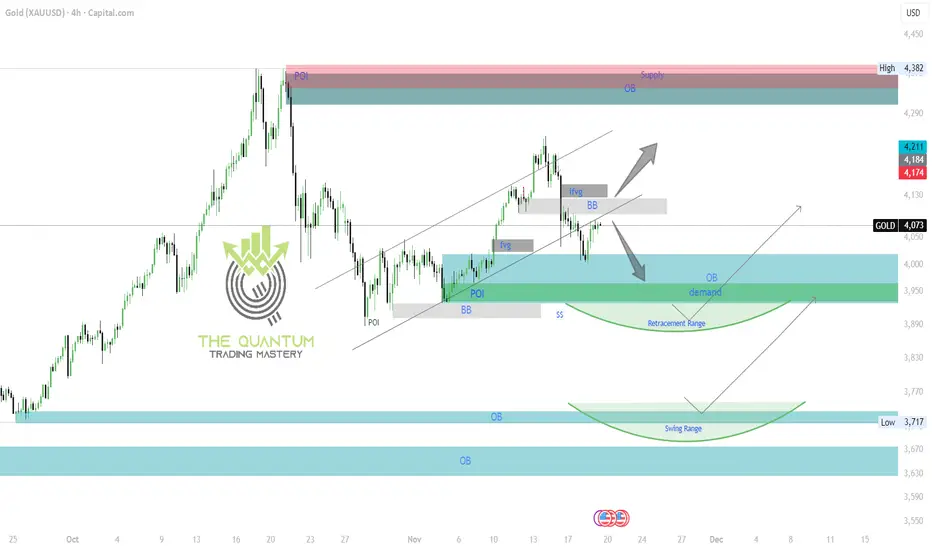
On the 4H chart, price is currently moving between two major weighted levels, with an imbalance (gap) above around 4124 and another below near 4000. As long as price remains trapped between these zones, we should expect a series of side-to-side tests until one of the weighted levels breaks and holds to confirm the next directional range.
With this structure in mind, the plan remains to buy dips from our key support levels. These updated levels — including POI, BB, OB, and demand zones — help us track the move downward and catch bullish reactions as price bounces.
Scenario 1:
If price rejects from above at the BB zone at 4115–4120, we anticipate a bearish move back toward the OB + Demand zone, potentially into the Retracement Range, to sweep liquidity.
A 4H candle closing below the Demand zone around 3930 would confirm a deeper leg into the Swing Range near the 3700 levels.
If the 4H candle does not close below demand and only performs a liquidity sweep, then we expect a push to higher levels afterward.
Scenario 2:
If price cross above level, the BB zone at 4115–4120, we consider bullish and target will be above supply zone at 4330.
Note:
The Swing Range produces much larger bounces compared to our weighted levels, which is the key difference between the two.
Continue buying dips at our support levels, aiming for 20–40 pip scalps.
Each structural level we mark is designed to give 20–40 pip bounces — ideal for clean entries and exits.
Please boost, share and comment if you like the idea and analysis.
The QUANTUM TRADING MASTERY
Dagangan aktif
Scenario 1: ActivatedIf price rejects from above at the BB zone at 4115–4120, we anticipate a bearish move back toward the OB + Demand zone, potentially into the Retracement Range, to sweep liquidity.
Nota
Trade is Still ActivePenerbitan berkaitan
Penafian
Maklumat dan penerbitan adalah tidak bertujuan, dan tidak membentuk, nasihat atau cadangan kewangan, pelaburan, dagangan atau jenis lain yang diberikan atau disahkan oleh TradingView. Baca lebih dalam Terma Penggunaan.
Penerbitan berkaitan
Penafian
Maklumat dan penerbitan adalah tidak bertujuan, dan tidak membentuk, nasihat atau cadangan kewangan, pelaburan, dagangan atau jenis lain yang diberikan atau disahkan oleh TradingView. Baca lebih dalam Terma Penggunaan.