10.15 Gold breaks high again, looking for retracement to continu
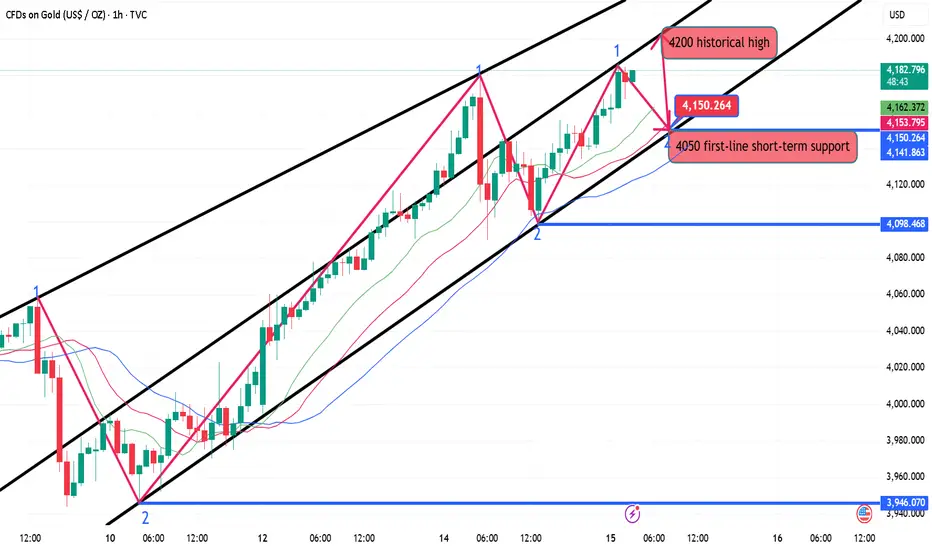
After a significant bearish candlestick pattern, the gold price's hourly chart immediately took off with a bullish candlestick pattern in the Asian session, signaling a rebound from a bottoming out. The large bullish candlestick pattern at the bottom solidified the base, and the moving average took off again, also trending almost vertically upward. The candlestick pattern remained above the moving average throughout, demonstrating the unstoppable bullish momentum. The upper limit remains at 4200.
Intraday short-term trading strategy:
BUY: 4150 Stop-loss: 4142
Top 1: 4185
Top 2: 4200
Intraday short-term trading strategy:
BUY: 4150 Stop-loss: 4142
Top 1: 4185
Top 2: 4200
Dagangan aktif
According to my analysis, gold has reached a historical high of nearly 4190 and will hit a new historical high of 4200 in the next stage.Dagangan ditutup: sasaran tercapai
The market has once again proven my strength. Gold has once again broken through the resistance to reach 4200. We have once again closed the position perfectly.The road to success is not crowded. As long as you choose the right direction and follow the right team, you will be able to move forward.
t.me/david_456654
t.me/david_456654
Penerbitan berkaitan
Penafian
Maklumat dan penerbitan adalah tidak dimaksudkan untuk menjadi, dan tidak membentuk, nasihat untuk kewangan, pelaburan, perdagangan dan jenis-jenis lain atau cadangan yang dibekalkan atau disahkan oleh TradingView. Baca dengan lebih lanjut di Terma Penggunaan.
The road to success is not crowded. As long as you choose the right direction and follow the right team, you will be able to move forward.
t.me/david_456654
t.me/david_456654
Penerbitan berkaitan
Penafian
Maklumat dan penerbitan adalah tidak dimaksudkan untuk menjadi, dan tidak membentuk, nasihat untuk kewangan, pelaburan, perdagangan dan jenis-jenis lain atau cadangan yang dibekalkan atau disahkan oleh TradingView. Baca dengan lebih lanjut di Terma Penggunaan.