XAU/USD Chart Analysis (H1 timeframe)
Here’s the English version of the breakdown:
1. Main Trend
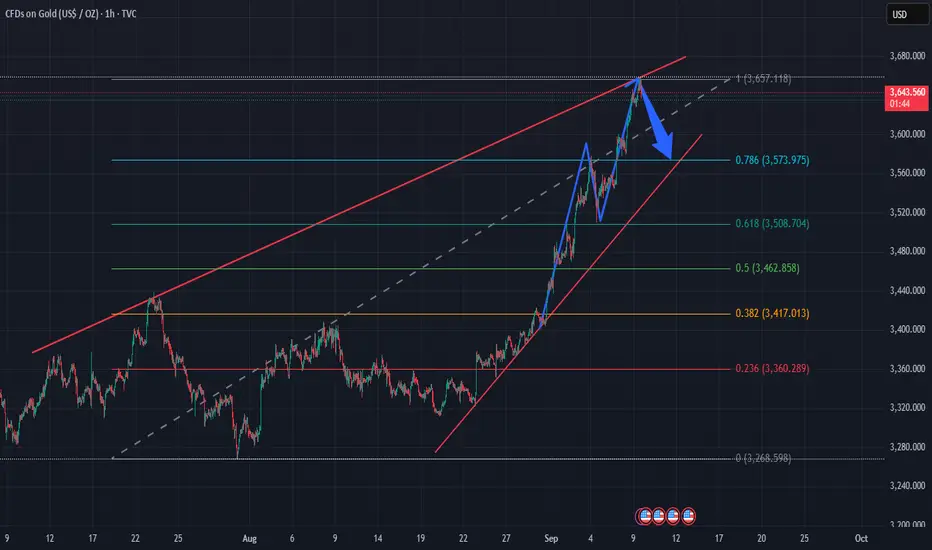
Gold has been in a strong uptrend, moving from the 3,330 → 3,660 USD zone.
The red trendlines form a steep ascending channel.
However, around the 3,660 resistance level, price shows signs of stalling.
2. Chart Pattern
A Rising Wedge pattern can be identified.
This is typically a bearish reversal signal once price breaks below the lower trendline.
The blue arrows highlight a potential move: strong push up → rejection → pullback to retest support.
3. Fibonacci Retracement
Key retracement levels:
0.236 ≈ 3,360
0.382 ≈ 3,420
0.5 ≈ 3,480
0.618 ≈ 3,520
0.786 ≈ 3,560
Currently, price is testing the 0.786 zone (3,560–3,580). A break lower could trigger a deeper correction.
4. Short-Term Scenarios
Scenario 1 (preferred): Price rejects the 3,660 resistance → correction toward 3,560 → 3,520 → 3,480.
Scenario 2 (less likely): If price breaks above 3,660 with strong volume, it may extend toward 3,700.
5. Trading Strategy (for reference)
Short entries: 3,640–3,660
Stop Loss: above 3,680
Take Profit: 3,560 → 3,520 → 3,480
Long entries: Only if price sustains above the trendline and breaks 3,660 with strong bullish momentum.
👉 Summary: Gold is facing heavy resistance at 3,660. The broader trend is still bullish, but short-term signals suggest a potential pullback toward the 0.618–0.5 Fibonacci zones (3,520–3,480).
Here’s the English version of the breakdown:
1. Main Trend
Gold has been in a strong uptrend, moving from the 3,330 → 3,660 USD zone.
The red trendlines form a steep ascending channel.
However, around the 3,660 resistance level, price shows signs of stalling.
2. Chart Pattern
A Rising Wedge pattern can be identified.
This is typically a bearish reversal signal once price breaks below the lower trendline.
The blue arrows highlight a potential move: strong push up → rejection → pullback to retest support.
3. Fibonacci Retracement
Key retracement levels:
0.236 ≈ 3,360
0.382 ≈ 3,420
0.5 ≈ 3,480
0.618 ≈ 3,520
0.786 ≈ 3,560
Currently, price is testing the 0.786 zone (3,560–3,580). A break lower could trigger a deeper correction.
4. Short-Term Scenarios
Scenario 1 (preferred): Price rejects the 3,660 resistance → correction toward 3,560 → 3,520 → 3,480.
Scenario 2 (less likely): If price breaks above 3,660 with strong volume, it may extend toward 3,700.
5. Trading Strategy (for reference)
Short entries: 3,640–3,660
Stop Loss: above 3,680
Take Profit: 3,560 → 3,520 → 3,480
Long entries: Only if price sustains above the trendline and breaks 3,660 with strong bullish momentum.
👉 Summary: Gold is facing heavy resistance at 3,660. The broader trend is still bullish, but short-term signals suggest a potential pullback toward the 0.618–0.5 Fibonacci zones (3,520–3,480).
✅MY FREE FOREX & XAUUSD SIGNALS TELEGRAM CHANNEL:
t.me/Jenny_in_your_area
🔴9-12 signals per day
🔴Free knowledge support
🔴24/7 support for newbies.
🔴You always have priority.
JENDA FISH 😘
t.me/Jenny_in_your_area
🔴9-12 signals per day
🔴Free knowledge support
🔴24/7 support for newbies.
🔴You always have priority.
JENDA FISH 😘
Penerbitan berkaitan
Penafian
Maklumat dan penerbitan adalah tidak dimaksudkan untuk menjadi, dan tidak membentuk, nasihat untuk kewangan, pelaburan, perdagangan dan jenis-jenis lain atau cadangan yang dibekalkan atau disahkan oleh TradingView. Baca dengan lebih lanjut di Terma Penggunaan.