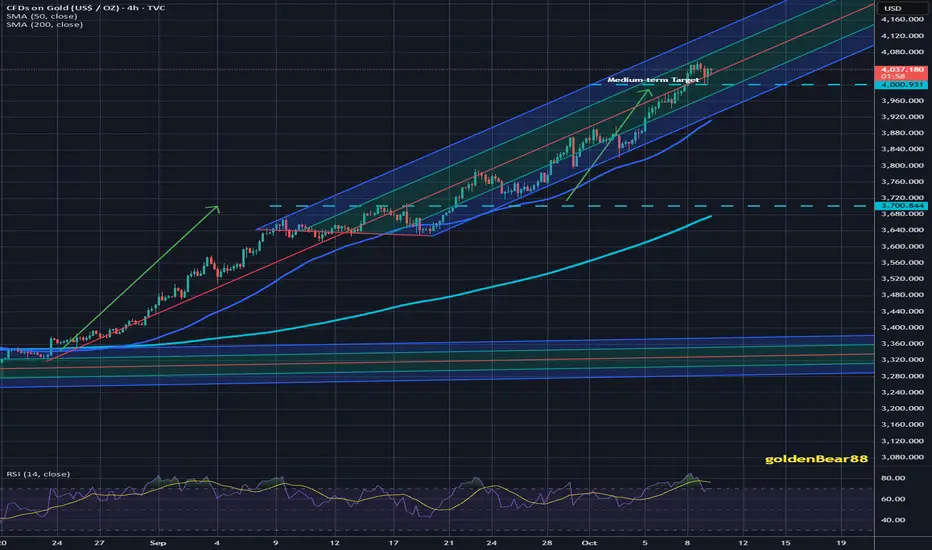
Technical analysis: Gold reversed on Intra-day basis (even though DX is Trading near multi-session High’s, from now on / main correlation for the fractal) as Price-action was isolated within Neutral Rectangle which has Lower High's / High's - Low's. As I've mentioned before, current slide was nothing more but sweep to cool down Overbought levels however not discontinuation of Ascending Channel on bigger charts.. Hourly 4 chart's timeframe should turn green any minute now and as long as Price-action meets strong Support near #4,000.80 psychological benchmark which is showcasing strong rejection point, I expect test-and-break of the #4,052.80 - #4,057.80 zone which can extend Buying sequence widely above #4,100.80 psychological benchmark, preserving trendline on Hourly 4 chart which is Supporting the uptrend and rejecting every downside attempt since late September / early October fractal. It is worth noting that if #4,052.80 - #4,057.80 Short-term Resistance zone rejects current recovery attempt, #3rd Top on mentioned belt which is guarding the upside will be formed as Gold will be isolated within #2 strong trendlines until one of the levels break and delivers major move on the aftermath (I lean to the Bullish side as well).
- My official Telegram Channel: t.me/goldenBear88
- I do provide professional Gold consulting (signals and financial advice) as well as #1 on #1 mentorship.
- Trading Gold since #2012' / support my analysis with 'like' if you already read it.
- I do provide professional Gold consulting (signals and financial advice) as well as #1 on #1 mentorship.
- Trading Gold since #2012' / support my analysis with 'like' if you already read it.
Penafian
Maklumat dan penerbitan adalah tidak dimaksudkan untuk menjadi, dan tidak membentuk, nasihat untuk kewangan, pelaburan, perdagangan dan jenis-jenis lain atau cadangan yang dibekalkan atau disahkan oleh TradingView. Baca dengan lebih lanjut di Terma Penggunaan.