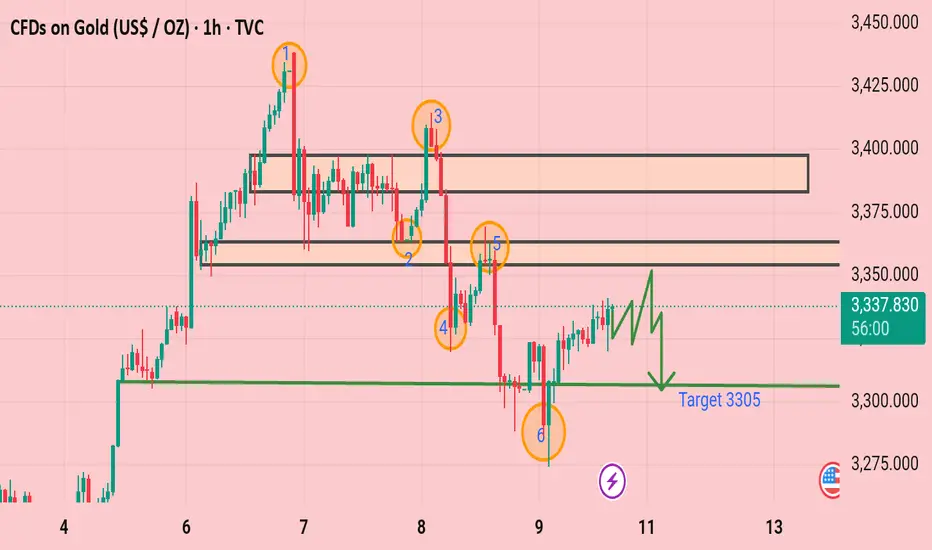
The chart you uploaded shows the price movement of Gold (XAU/USD) on a 1-hour timeframe from TradingView. Here are some key observations:
1. Resistance and Support Zones:
The chart highlights two major resistance zones around 3,400 and 3,360, shown as shaded rectangles.
A support zone is marked near the 3,305 level.
2. Labeled Points (1 to 6):
These numbered points indicate significant price action events or turning points.
Point 1: A peak after an upward trend, indicating resistance.
Point 2: A pullback, showing resistance holding.
Point 3: Another attempt to break resistance, followed by a sharp drop.
Point 4 and 5: Lower highs, confirming a downtrend.
Point 6: A strong support test near 3,305, with a rebound.
3. Price Movement and Trend:
The chart suggests a downtrend after failing to sustain above the resistance zone.
The drawn arrow points downward toward the 3,305 level, indicating a possible bearish target.
Current price: 3,337.33, with a recent bounce from support.
4. Projected Target:
The chart indicates a target of around 3,305, suggesting a bearish bias.
Would you like a more detailed technical analysis or insight into trading strategies based on this chart?
Dagangan ditutup: sasaran tercapai
Gold Target Successfully Archived.t.me/TheMoneyPrinter_Mentorship
XAUUSD GOLD + BTCUSD Daily 5-6 Free Signals📊🚀
✅GOLD
✅BTC
✅EURUSD
✅USDJPY
TELEGRAM CHANNEL 👇🏻👇🏻👇🏻👇🏻👇🏻👇🏻
t.me/TheMoneyPrinter_Mentorship
XAUUSD GOLD + BTCUSD Daily 5-6 Free Signals📊🚀
✅GOLD
✅BTC
✅EURUSD
✅USDJPY
TELEGRAM CHANNEL 👇🏻👇🏻👇🏻👇🏻👇🏻👇🏻
t.me/TheMoneyPrinter_Mentorship
Penafian
Maklumat dan penerbitan adalah tidak dimaksudkan untuk menjadi, dan tidak membentuk, nasihat untuk kewangan, pelaburan, perdagangan dan jenis-jenis lain atau cadangan yang dibekalkan atau disahkan oleh TradingView. Baca dengan lebih lanjut di Terma Penggunaan.
t.me/TheMoneyPrinter_Mentorship
XAUUSD GOLD + BTCUSD Daily 5-6 Free Signals📊🚀
✅GOLD
✅BTC
✅EURUSD
✅USDJPY
TELEGRAM CHANNEL 👇🏻👇🏻👇🏻👇🏻👇🏻👇🏻
t.me/TheMoneyPrinter_Mentorship
XAUUSD GOLD + BTCUSD Daily 5-6 Free Signals📊🚀
✅GOLD
✅BTC
✅EURUSD
✅USDJPY
TELEGRAM CHANNEL 👇🏻👇🏻👇🏻👇🏻👇🏻👇🏻
t.me/TheMoneyPrinter_Mentorship
Penafian
Maklumat dan penerbitan adalah tidak dimaksudkan untuk menjadi, dan tidak membentuk, nasihat untuk kewangan, pelaburan, perdagangan dan jenis-jenis lain atau cadangan yang dibekalkan atau disahkan oleh TradingView. Baca dengan lebih lanjut di Terma Penggunaan.