Gold Technical analysis
###🔍 **Overall Chart Context**
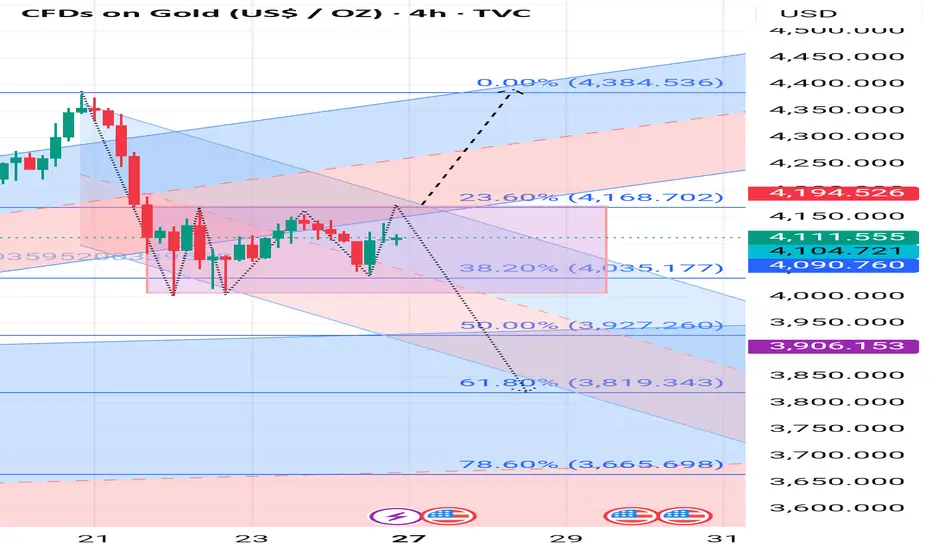
* The chart shows a **downward correction** after a recent swing high near **$4,384.536**.
* The current price is around **$4,111.55 USD/oz**, moving sideways within a **rectangular consolidation zone** (highlighted in pink).
* The **Fibonacci retracement tool** is drawn from the recent swing low to the swing high, showing potential retracement levels where price might react.
---
### 📉 **Fibonacci Levels and Key Zones**
| Fibonacci Level | Price Zone (USD) | Technical Meaning |
| --------------- | ---------------- | ------------------------------------------- |
| 23.6% | 4,168.702 | First minor resistance in a corrective move |
| 38.2% | 4,035.177 | Short-term support; currently being tested |
| 50.0% | 3,927.260 | Intermediate support (often key pivot) |
| 61.8% | 3,819.343 | Strong golden-ratio support zone |
| 78.6% | 3,665.698 | Deep retracement; could trigger reversal |
---
### 🧭 **Key Support and Resistance Levels**
**Resistance Levels:**
1. **$4,168 – $4,195** → 23.6% Fibonacci + upper channel zone; major resistance area.
2. **$4,384** → Recent swing high and strong structural resistance.
**Support Levels:**
1. **$4,035 – $4,090** → Current range bottom; 38.2% Fibonacci level.
2. **$3,927** → 50% retracement and midpoint of the trend channel.
3. **$3,819** → 61.8% Fibonacci (golden zone) — strong potential rebound area.
4. **$3,665** → Final major support; if broken, trend may turn fully bearish.
---
### 📊 **Current Price Action**
* Gold is **consolidating sideways** within a rectangular box between **$4,035 – $4,168**, showing **indecision** before the next major move.
* The candles indicate **buying pressure near the bottom** and **selling pressure near the top** of the box.
* The trend channel (red and blue parallel zones) indicates **bearish momentum dominance** in the short term.
---
### 🔮 **Forecast (Next Move Outlook)**
**📈 Bullish Scenario:**
* If price **breaks above $4,170 – $4,195** with strong volume, next targets:
* **$4,250**, then **$4,384** (previous swing high).
* Momentum would shift toward a recovery rally.
**📉 Bearish Scenario:**
* If price **breaks below $4,035**, expect:
* First drop toward **$3,927 (50% Fib)**, then **$3,819 (61.8%)**.
* A sustained move below **$3,819** may confirm a **bearish continuation** targeting **$3,665**.
**🎯 Neutral / Range-Bound:**
* Until a clear breakout occurs, Gold may **oscillate between $4,035 and $4,170**, forming a **consolidation base** before the next directional move.
---
### 🧠 **Summary**
| Trend | Status |
| -------------- | -------------------------------------------------------------------------------------------------- |
| Short-Term | Sideways / Consolidating |
| Medium-Term | Bearish bias below $4,170 |
| Key Support | $4,035 / $3,927 / $3,819 |
| Key Resistance | $4,168 / $4,195 / $4,384 |
| Forecast | Possible drop toward $3,927–$3,819 if $4,035 breaks; bullish breakout above $4,195 targets $4,384+ |
---
###🔍 **Overall Chart Context**
* The chart shows a **downward correction** after a recent swing high near **$4,384.536**.
* The current price is around **$4,111.55 USD/oz**, moving sideways within a **rectangular consolidation zone** (highlighted in pink).
* The **Fibonacci retracement tool** is drawn from the recent swing low to the swing high, showing potential retracement levels where price might react.
---
### 📉 **Fibonacci Levels and Key Zones**
| Fibonacci Level | Price Zone (USD) | Technical Meaning |
| --------------- | ---------------- | ------------------------------------------- |
| 23.6% | 4,168.702 | First minor resistance in a corrective move |
| 38.2% | 4,035.177 | Short-term support; currently being tested |
| 50.0% | 3,927.260 | Intermediate support (often key pivot) |
| 61.8% | 3,819.343 | Strong golden-ratio support zone |
| 78.6% | 3,665.698 | Deep retracement; could trigger reversal |
---
### 🧭 **Key Support and Resistance Levels**
**Resistance Levels:**
1. **$4,168 – $4,195** → 23.6% Fibonacci + upper channel zone; major resistance area.
2. **$4,384** → Recent swing high and strong structural resistance.
**Support Levels:**
1. **$4,035 – $4,090** → Current range bottom; 38.2% Fibonacci level.
2. **$3,927** → 50% retracement and midpoint of the trend channel.
3. **$3,819** → 61.8% Fibonacci (golden zone) — strong potential rebound area.
4. **$3,665** → Final major support; if broken, trend may turn fully bearish.
---
### 📊 **Current Price Action**
* Gold is **consolidating sideways** within a rectangular box between **$4,035 – $4,168**, showing **indecision** before the next major move.
* The candles indicate **buying pressure near the bottom** and **selling pressure near the top** of the box.
* The trend channel (red and blue parallel zones) indicates **bearish momentum dominance** in the short term.
---
### 🔮 **Forecast (Next Move Outlook)**
**📈 Bullish Scenario:**
* If price **breaks above $4,170 – $4,195** with strong volume, next targets:
* **$4,250**, then **$4,384** (previous swing high).
* Momentum would shift toward a recovery rally.
**📉 Bearish Scenario:**
* If price **breaks below $4,035**, expect:
* First drop toward **$3,927 (50% Fib)**, then **$3,819 (61.8%)**.
* A sustained move below **$3,819** may confirm a **bearish continuation** targeting **$3,665**.
**🎯 Neutral / Range-Bound:**
* Until a clear breakout occurs, Gold may **oscillate between $4,035 and $4,170**, forming a **consolidation base** before the next directional move.
---
### 🧠 **Summary**
| Trend | Status |
| -------------- | -------------------------------------------------------------------------------------------------- |
| Short-Term | Sideways / Consolidating |
| Medium-Term | Bearish bias below $4,170 |
| Key Support | $4,035 / $3,927 / $3,819 |
| Key Resistance | $4,168 / $4,195 / $4,384 |
| Forecast | Possible drop toward $3,927–$3,819 if $4,035 breaks; bullish breakout above $4,195 targets $4,384+ |
---
Penafian
Maklumat dan penerbitan adalah tidak dimaksudkan untuk menjadi, dan tidak membentuk, nasihat untuk kewangan, pelaburan, perdagangan dan jenis-jenis lain atau cadangan yang dibekalkan atau disahkan oleh TradingView. Baca dengan lebih lanjut di Terma Penggunaan.
Penafian
Maklumat dan penerbitan adalah tidak dimaksudkan untuk menjadi, dan tidak membentuk, nasihat untuk kewangan, pelaburan, perdagangan dan jenis-jenis lain atau cadangan yang dibekalkan atau disahkan oleh TradingView. Baca dengan lebih lanjut di Terma Penggunaan.