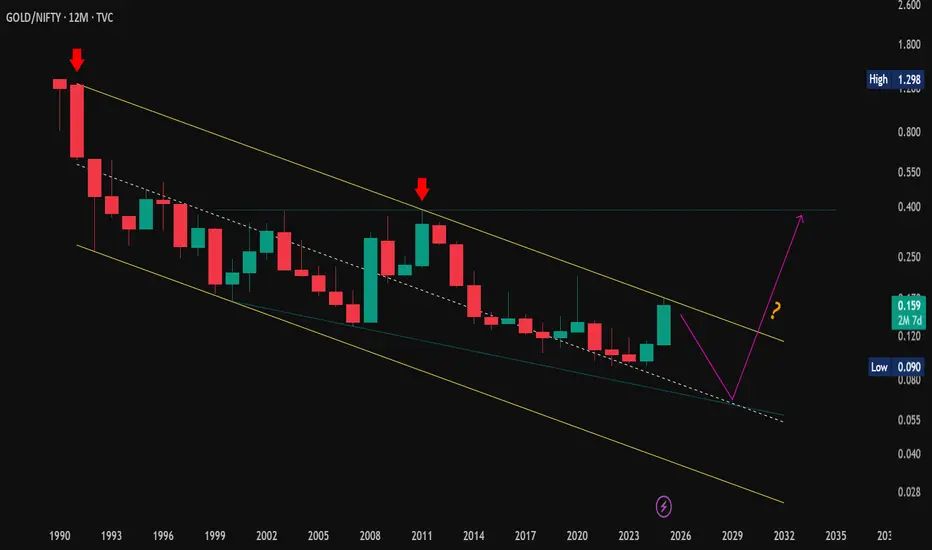
🥇 #GOLD/#NIFTY Ratio (Yearly Chart)
📊 What Is the GOLD/NIFTY Ratio?
This ratio tracks how Gold performs vs. Indian equities (NIFTY) over time.
📈 Ratio ⬆️ → Gold outperforming NIFTY
📉 Ratio ⬇️ → NIFTY outperforming Gold
📍 Current Market Setup:
Trading inside a long-term falling channel (35 years) - consistent lower highs & lower lows
Recently made a strong rebound from the lower boundary, but the LH–LL structure remains valid
📈 Trend Insight:
✅ Primary Trend: Long-term downtrend (favoring equities)
⚠️ Short-Term: Momentum turning positive — possible medium-term Gold strength
💡 Still below major resistance, so reversal not yet confirmed
🧭 Possible Scenarios:
✅ Continued bounce → Gold may outperform for a while
❌ Rejection from channel top → NIFTY likely resumes dominance
⏳ Neutral for now → Watch for breakout or rejection from top of the falling channel
🏁 Macro Takeaway:
The GOLD/NIFTY ratio sits at a critical long-term zone.
A breakout could mark a major rotation from equities to Gold, while rejection keeps the equity uptrend intact.
Smart investors can use this ratio to balance equity vs. Gold exposure over long cycles. ⚖️
#GoldVsEquity | #NiftyVsGold | #AssetAllocation | #InvestSmart | #Nifty50 | #GoldInvestment | #TechnicalAnalysis | #MarketTrends | #WealthBuilding | #LongTermInvesting
Penerbitan berkaitan
Penafian
The information and publications are not meant to be, and do not constitute, financial, investment, trading, or other types of advice or recommendations supplied or endorsed by TradingView. Read more in the Terms of Use.
Penerbitan berkaitan
Penafian
The information and publications are not meant to be, and do not constitute, financial, investment, trading, or other types of advice or recommendations supplied or endorsed by TradingView. Read more in the Terms of Use.