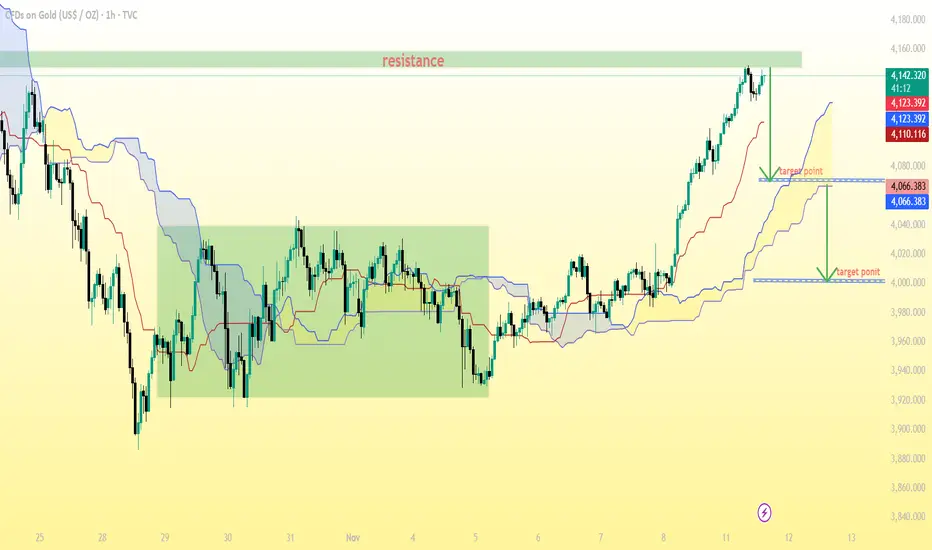
GOLD (XAU/USD) 1-hour chart with Ichimoku Cloud, and my marked resistance and two target points.
Here’s the analysis based on what’s visible:
Current price: Around $4,141 (based on my chart labels).
Resistance zone: Around $4,140 – $4,150, which is where price is currently testing.
Upper target point (minor correction target): Around $4,123 – $4,125.
Lower target point (major correction target): Around $4,066 – $4,070.
📊 Interpretation:
If price fails to break resistance (4,150) and forms rejection candles, it could retrace toward:
Target 1: $4,123 (short-term support)
Target 2: $4,066 (cloud base and major support zone)
If price breaks and holds above 4,150, then the bullish trend can extend further upward, possibly toward $4,180–$4,200.
Dagangan aktif
active Penerbitan berkaitan
Penafian
Maklumat dan penerbitan adalah tidak bertujuan, dan tidak membentuk, nasihat atau cadangan kewangan, pelaburan, dagangan atau jenis lain yang diberikan atau disahkan oleh TradingView. Baca lebih dalam Terma Penggunaan.
Penerbitan berkaitan
Penafian
Maklumat dan penerbitan adalah tidak bertujuan, dan tidak membentuk, nasihat atau cadangan kewangan, pelaburan, dagangan atau jenis lain yang diberikan atau disahkan oleh TradingView. Baca lebih dalam Terma Penggunaan.