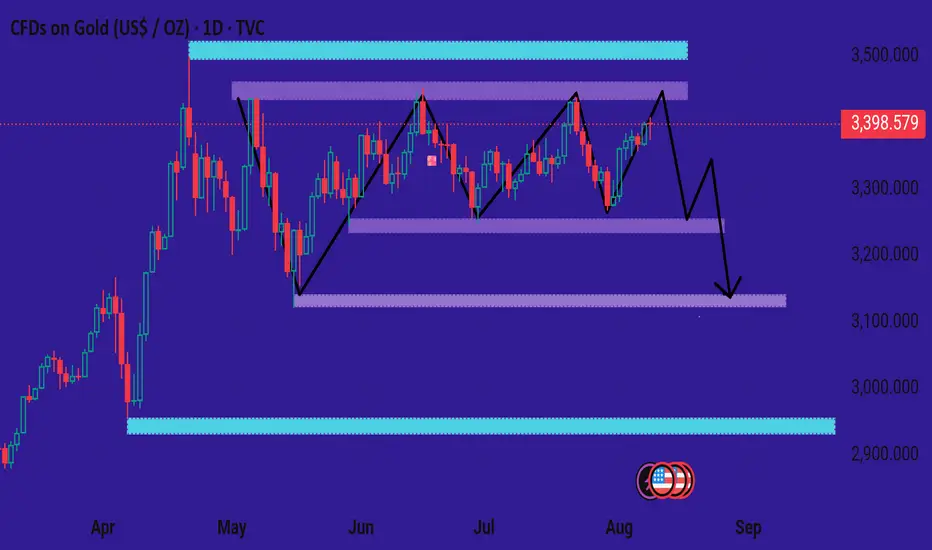
Your chart shows gold (XAU/USD) in a broad horizontal range between roughly $3,220 (support) and $3,460 (resistance), with price currently near the upper zone (~$3,398).
Here’s the breakdown:
Pattern: A sideways range with multiple swings between the two zones, marked by the zigzag black lines.
Current move: The price is at the top of the range after several oscillations, suggesting potential resistance pressure.
Projection: Your drawing shows a bearish scenario—expecting a drop from near resistance, breaking mid-range support ($3,050–$3,100).
Measured move: The highlighted blue vertical bars suggest a projected drop of around $394 (≈ 11.65%), mirroring prior range height.
Key zones:
Resistance: $3,440–$3,460 (upper purple + blue zone)
Mid-support: $3,300–$3,320
Major support: $3,050–$3,100
This looks like a range top rejection setup, anticipating a downward swing to retest range lows unless bulls break above $3,460 with strong momentum.
If you want, I can also mark exact entry, stop-loss, and target levels based on this setup.
Penafian
Maklumat dan penerbitan adalah tidak dimaksudkan untuk menjadi, dan tidak membentuk, nasihat untuk kewangan, pelaburan, perdagangan dan jenis-jenis lain atau cadangan yang dibekalkan atau disahkan oleh TradingView. Baca dengan lebih lanjut di Terma Penggunaan.
Penafian
Maklumat dan penerbitan adalah tidak dimaksudkan untuk menjadi, dan tidak membentuk, nasihat untuk kewangan, pelaburan, perdagangan dan jenis-jenis lain atau cadangan yang dibekalkan atau disahkan oleh TradingView. Baca dengan lebih lanjut di Terma Penggunaan.