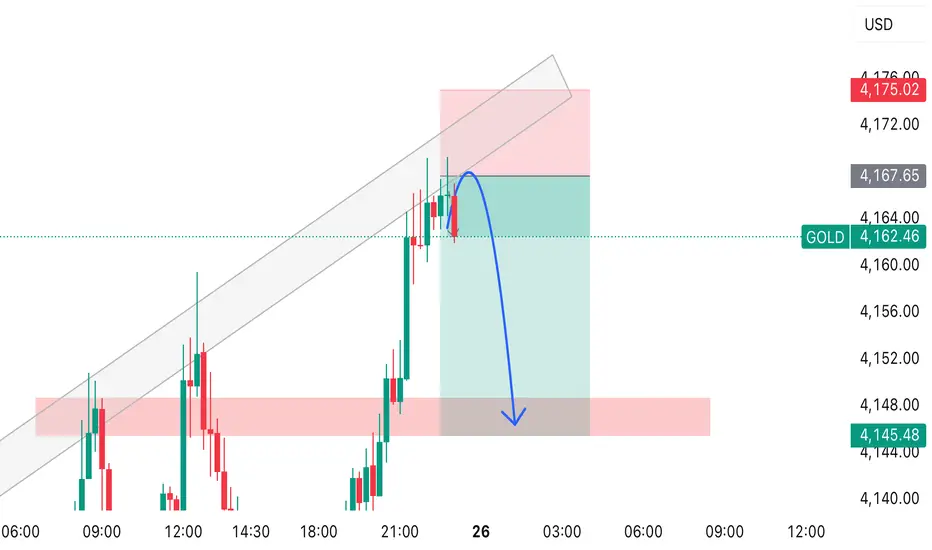
This TradingView chart shows GOLD price action approaching a resistance zone near 4167–4170 USD.
Price has been moving inside an ascending channel, shown with grey trendlines.
At the top of the channel, a rejection candle appears, and you’ve drawn a blue arrow indicating your expected move:
📉 Expected Move
• Price is expected to drop from the resistance zone.
• The arrow shows a move down towards the support demand zone near 4145–4150 USD (highlighted in red).
Dagangan aktif
Active Dagangan ditutup: sasaran tercapai
Target reached 🔥Penafian
Maklumat dan penerbitan adalah tidak bertujuan, dan tidak membentuk, nasihat atau cadangan kewangan, pelaburan, dagangan atau jenis lain yang diberikan atau disahkan oleh TradingView. Baca lebih dalam Terma Penggunaan.
Penafian
Maklumat dan penerbitan adalah tidak bertujuan, dan tidak membentuk, nasihat atau cadangan kewangan, pelaburan, dagangan atau jenis lain yang diberikan atau disahkan oleh TradingView. Baca lebih dalam Terma Penggunaan.