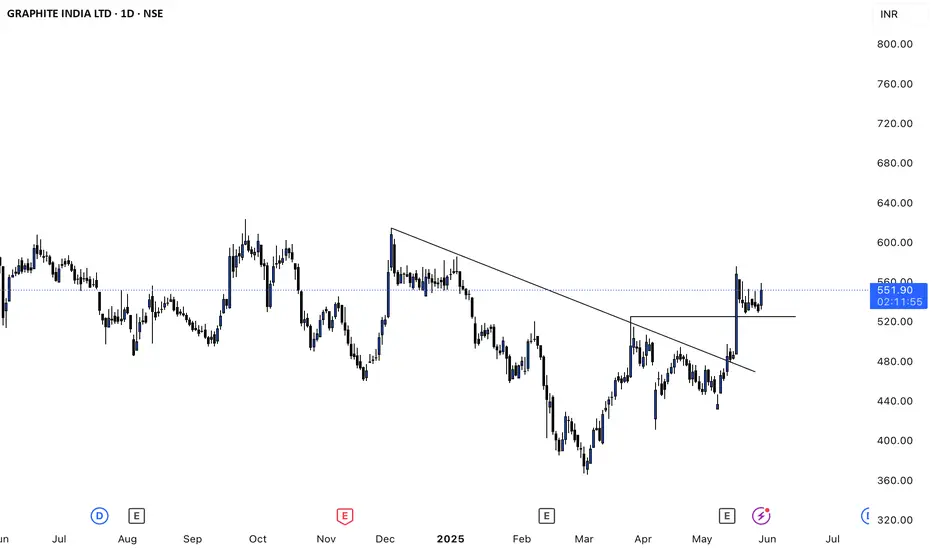
Graphite India Ltd's share price is currently around ₹530.95 to ₹555.45 as of May 29, 2025. The stock has shown strong short-term momentum, gaining over 20% in the past month and more than 40% in the last three months. However, its one-year return is negative, down about 4–6%, underperforming the broader Sensex, though its five-year return remains impressive at over 190%[1][2].
Analyst sentiment is positive, with both covering analysts rating the stock as a "Strong Buy." Their average 12-month target price is ₹654, representing an upside of about 20–23% from current levels[4][5]. The highest target is ₹718 and the lowest is ₹590[4].
From a valuation perspective, Graphite India trades at a price-to-earnings (P/E) ratio of about 22–23x, which is significantly lower than its peer average (42x) and the broader Indian electrical industry average (nearly 40x). This suggests the stock is relatively undervalued compared to its sector[4]. The estimated fair value per discounted cash flow models is around ₹421, so the current price is above fundamental fair value, but still below the fair P/E valuation of 49.8x[4].
Recent financials show volatility: revenue and net income have fluctuated quarter to quarter, with a notable recovery in Q1 FY25 after a loss in the previous quarter. Net profit margin also rebounded to 7.36% in the latest quarter[5].
Technically, the stock is experiencing mixed signals. Weekly indicators like MACD and Bollinger Bands suggest a mildly bullish trend, but monthly indicators remain sideways to mildly bearish. The daily trend is mildly bearish, reflecting some short-term caution despite strong recent gains[2].
In summary, Graphite India has recently rebounded sharply but remains below its 52-week high. It is seen as undervalued relative to peers, with analysts expecting further upside. However, technical and fundamental signals are mixed, so investors should watch for continued volatility and monitor quarterly performance for sustained recovery[1][2][4][5].
Penafian
Maklumat dan penerbitan adalah tidak dimaksudkan untuk menjadi, dan tidak membentuk, nasihat untuk kewangan, pelaburan, perdagangan dan jenis-jenis lain atau cadangan yang dibekalkan atau disahkan oleh TradingView. Baca dengan lebih lanjut di Terma Penggunaan.
Penafian
Maklumat dan penerbitan adalah tidak dimaksudkan untuk menjadi, dan tidak membentuk, nasihat untuk kewangan, pelaburan, perdagangan dan jenis-jenis lain atau cadangan yang dibekalkan atau disahkan oleh TradingView. Baca dengan lebih lanjut di Terma Penggunaan.
