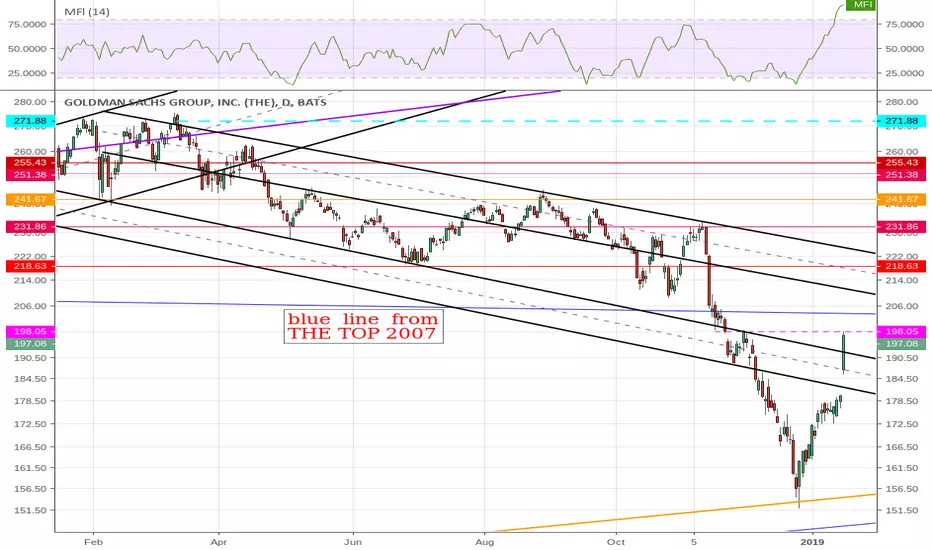
GAP resistance again
Blue line from the highest high and down trending
[the recent high breaking this trend all QE ? ]
channels are resistance zones from gaps and hi/low peaks [ R&S}
[ hate i can not see chart while making comments ! ]
seeing if secondary resistance lines are S&R - noticing gaps in these channels occasionally
Penafian
Maklumat dan penerbitan adalah tidak dimaksudkan untuk menjadi, dan tidak membentuk, nasihat untuk kewangan, pelaburan, perdagangan dan jenis-jenis lain atau cadangan yang dibekalkan atau disahkan oleh TradingView. Baca dengan lebih lanjut di Terma Penggunaan.
Penafian
Maklumat dan penerbitan adalah tidak dimaksudkan untuk menjadi, dan tidak membentuk, nasihat untuk kewangan, pelaburan, perdagangan dan jenis-jenis lain atau cadangan yang dibekalkan atau disahkan oleh TradingView. Baca dengan lebih lanjut di Terma Penggunaan.
