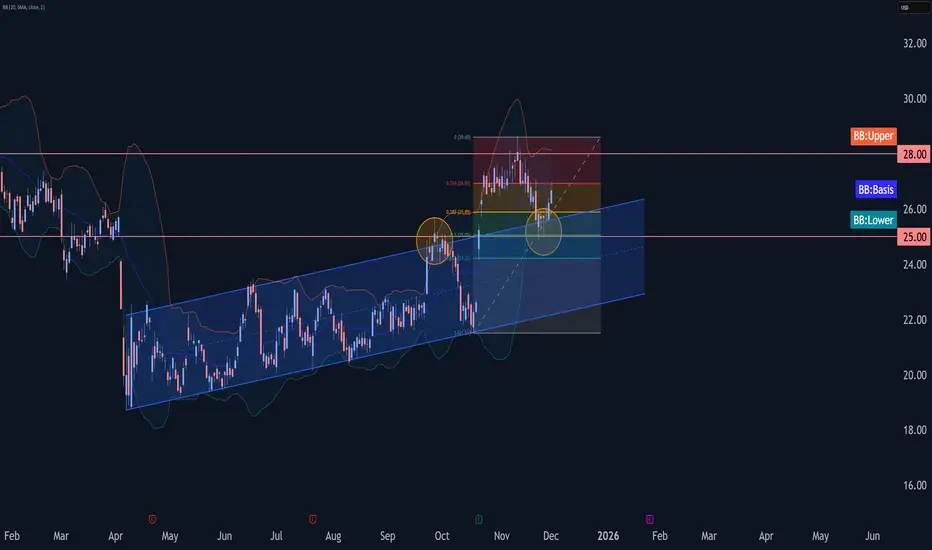
- Halliburton reversed from support zone
- Likely to rise to resistance level 28.00
Halliburton recently reversed from the support zone between the support level 25.00 (former resistance from September), lower daily Bollinger Band and the 50% Fibonacci correction of the upward impulse from October.
The upward reversal from this support zone started the active short-term impulse wave 5.
Given the clear daily uptrend, Halliburton can be expected to rise to the next resistance level 28.00 (which stopped the previous wave b).
By the FxPro Analyst Team
Follow our dedicated Telegram channel t.me/fxpro for insightful market analysis and expert commentary.
Reach out to media.comments@fxpro.com for PR and media inquiries
Follow our dedicated Telegram channel t.me/fxpro for insightful market analysis and expert commentary.
Reach out to media.comments@fxpro.com for PR and media inquiries
Penafian
Maklumat dan penerbitan adalah tidak bertujuan, dan tidak membentuk, nasihat atau cadangan kewangan, pelaburan, dagangan atau jenis lain yang diberikan atau disahkan oleh TradingView. Baca lebih dalam Terma Penggunaan.