HDFC AMC LTD | Bullish Momentum + Possible Breakout
📈 HDFC AMC LTD | Bullish Momentum + Possible Breakout 🚀
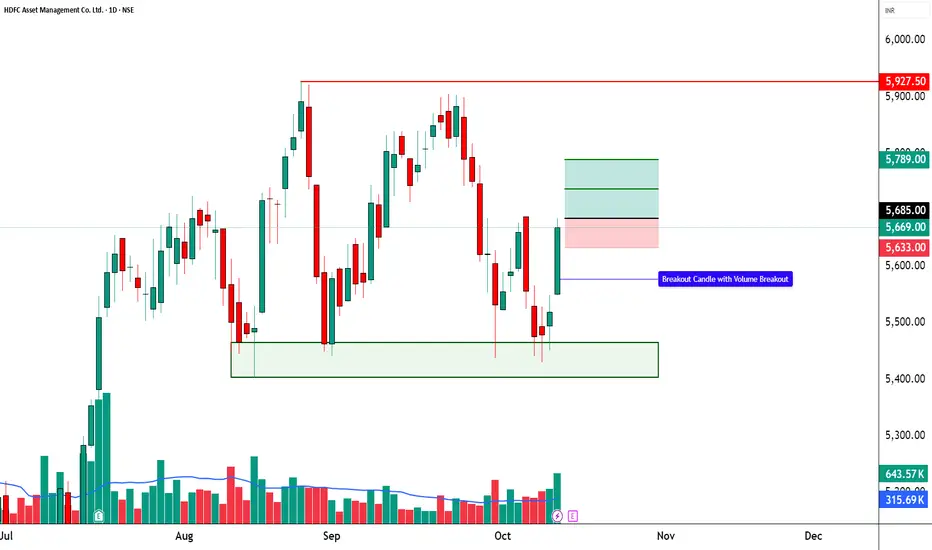
🔹 Bullish Breakout Zone: 5,660 – 5,685
🔹 Stop Loss: 5,633 (Risk ~₹52)
🔹 Supports: 5,584 / 5,499 / 5,448
🔹 Resistances: 5,719 / 5,770 / 5,855
🔑 Key Highlights
HDFC AMC has formed a strong bullish candle with a notable volume surge, clearly confirming aggressive buying interest. The RSI breakout signals a shift in momentum after a prolonged consolidation phase, indicating that the stock is gaining renewed strength. Additionally, a Bollinger Band Squeeze-Off pattern is visible, suggesting a potential volatility expansion and a short-term breakout on the upside. The spike in trading volume further reinforces the bullish sentiment, hinting at possible institutional participation behind this move.
🎯 STWP Trade View
📊 Price has reclaimed control above near-term resistances with improving momentum.
A sustained close above ₹5,719 can trigger a move toward ₹5,770–₹5,855 levels in the short term.
Pullbacks toward ₹5,640–₹5,660 may offer favorable entry zones with tight risk control.
⚠️ Supports at ₹5,584 and ₹5,499 remain crucial for maintaining the swing structure and protecting positions.
________________________________________
📊 Final Outlook
Momentum: 🔥 Strong
Trend: 📉 Bearish (but reversing)
Risk: 🟢 Low
Volume: 📈 High
________________________________________
💡 Learning Note
This setup demonstrates the power of confluence — RSI breakout + BB squeeze + volume surge.
Such multi-signal alignments often mark the start of a momentum phase, offering early entry opportunities before a confirmed breakout rally.
________________________________________
________________________________________
⚠️ Disclosure & Disclaimer – Please Read Carefully
The information shared here is meant purely for learning and awareness. It is not a buy or sell recommendation and should not be taken as investment advice. I am not a SEBI-registered investment adviser, and all views expressed are based on personal study, chart patterns, and publicly available market data.
Trading—whether in stocks or options—carries risk. Markets can move unexpectedly, and losses can sometimes exceed the money you have invested. Past performance or past setups do not guarantee future results.
If you are a beginner, treat this as a guide to understand how the market works and practice on paper trades before risking real money. If you are experienced, always assess your own risk, position sizing, and strategy suitability before entering trades.
Consult a SEBI-registered financial adviser before making any real trading decision. By engaging with this content, you acknowledge full responsibility for your trades and investments.
Position Status: No active position in HDFCAMC at the time of analysis.
Data Source: TradingView & NSE India (Past Chart Reference) (Historical levels)
💬 Found this useful?
🔼 Give this post a Boost to help more traders discover clean, structured learning.
✍️ Drop your thoughts, questions, or setups in the comments — let’s grow together!
🔁 Share with fellow traders and beginners to spread awareness.
👉 “If you liked this breakdown, follow for more clean, structured setups with discipline at the core.”
🚀 Stay Calm. Stay Clean. Trade With Patience.
Trade Smart | Learn Zones | Be Self-Reliant 📊
Dagangan ditutup: hentian tercapai
STWP | Mentor & Demand-Supply Specialist | Empowering traders through structured learning |
simpletradewithpatience.com
Community: chat.whatsapp.com/BEYz0tkqP0fJPBCWf59uel
wa.me/message/6IOPHGOXMGZ4N1
Educational Only
simpletradewithpatience.com
Community: chat.whatsapp.com/BEYz0tkqP0fJPBCWf59uel
wa.me/message/6IOPHGOXMGZ4N1
Educational Only
Penerbitan berkaitan
Penafian
Maklumat dan penerbitan adalah tidak bertujuan, dan tidak membentuk, nasihat atau cadangan kewangan, pelaburan, dagangan atau jenis lain yang diberikan atau disahkan oleh TradingView. Baca lebih dalam Terma Penggunaan.