📊 Current Snapshot
Price: Around ₹1,995 (~₹1,990–₹2,000 range)
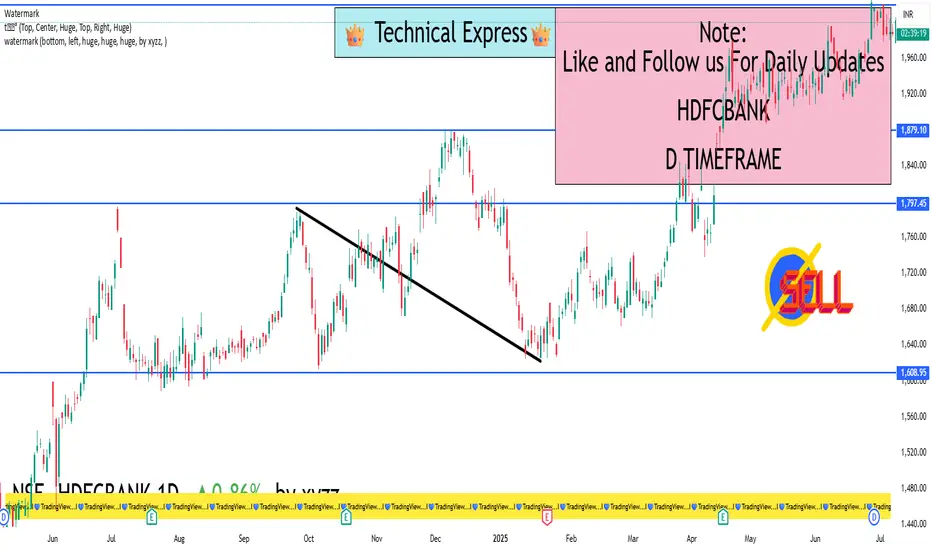
52-week range: ₹1,588 – ₹2,027 — just below the recent high
✅ Technical Momentum
Overview: Daily technical summary is a "Strong Buy", with moving averages and indicators like RSI (55.3), Stoch, ADX, and CCI all in buy territory
Pivot Level Support: Standard pivots are around ₹1,995
RS Rating (ADR): Strong (83) — above the 80 mark, but extended — suggesting good trend; watch pullbacks
🛡️ Key Price Zones
Support / Buy-on-Dip Areas
₹1,995–₹1,998 – Daily pivot zone
₹1,982–₹1,990 – Standard S1 support
₹1,960–₹1,970 – Deeper Fibonacci/S2 pivot zone
₹1,932–₹1,940 – Strong long-term support (S3–S4 levels)
Resistance / Profit Exit Zones
₹2,007–₹2,015 – Immediate upside pivot resistance (R1–R2)
₹2,024–₹2,025 – R2 zone
₹2,030+ – R3/R4 zone — breakout territory
🧭 Action Plan
1. Currently Holding?
Stay invested — indicators are still bullish.
Think about taking partial profits in the ₹2,015–₹2,025 range, especially if the market overall gets choppy.
2. Planning to Buy?
Best entry: around ₹1,982–₹1,990 (safe zone).
If broader markets dip more, ideal accumulation range is ₹1,960–₹1,970.
Aggressive buying can start near ₹1,995 but keep stop-loss close.
3. Breakout Strategy
A clean, daily close above ₹2,025–₹2,030 on good volume opens up fresh upside toward all-time highs (~₹2,027+).
Can add more after breakout with confidence.
4. Risk Management
Entry around ₹1,982–₹1,990 → set stop-loss below ₹1,960.
If buying near ₹1,960–₹1,970 → stop-loss could be ₹1,930.
Price: Around ₹1,995 (~₹1,990–₹2,000 range)
52-week range: ₹1,588 – ₹2,027 — just below the recent high
✅ Technical Momentum
Overview: Daily technical summary is a "Strong Buy", with moving averages and indicators like RSI (55.3), Stoch, ADX, and CCI all in buy territory
Pivot Level Support: Standard pivots are around ₹1,995
RS Rating (ADR): Strong (83) — above the 80 mark, but extended — suggesting good trend; watch pullbacks
🛡️ Key Price Zones
Support / Buy-on-Dip Areas
₹1,995–₹1,998 – Daily pivot zone
₹1,982–₹1,990 – Standard S1 support
₹1,960–₹1,970 – Deeper Fibonacci/S2 pivot zone
₹1,932–₹1,940 – Strong long-term support (S3–S4 levels)
Resistance / Profit Exit Zones
₹2,007–₹2,015 – Immediate upside pivot resistance (R1–R2)
₹2,024–₹2,025 – R2 zone
₹2,030+ – R3/R4 zone — breakout territory
🧭 Action Plan
1. Currently Holding?
Stay invested — indicators are still bullish.
Think about taking partial profits in the ₹2,015–₹2,025 range, especially if the market overall gets choppy.
2. Planning to Buy?
Best entry: around ₹1,982–₹1,990 (safe zone).
If broader markets dip more, ideal accumulation range is ₹1,960–₹1,970.
Aggressive buying can start near ₹1,995 but keep stop-loss close.
3. Breakout Strategy
A clean, daily close above ₹2,025–₹2,030 on good volume opens up fresh upside toward all-time highs (~₹2,027+).
Can add more after breakout with confidence.
4. Risk Management
Entry around ₹1,982–₹1,990 → set stop-loss below ₹1,960.
If buying near ₹1,960–₹1,970 → stop-loss could be ₹1,930.
I built a Buy & Sell Signal Indicator with 85% accuracy.
📈 Get access via DM or
WhatsApp: wa.link/d997q0
Contact - +91 76782 40962
| Email: techncialexpress@gmail.com
| Script Coder | Trader | Investor | From India
📈 Get access via DM or
WhatsApp: wa.link/d997q0
Contact - +91 76782 40962
| Email: techncialexpress@gmail.com
| Script Coder | Trader | Investor | From India
Penerbitan berkaitan
Penafian
Maklumat dan penerbitan adalah tidak bertujuan, dan tidak membentuk, nasihat atau cadangan kewangan, pelaburan, dagangan atau jenis lain yang diberikan atau disahkan oleh TradingView. Baca lebih dalam Terma Penggunaan.