📊Technical Analysis
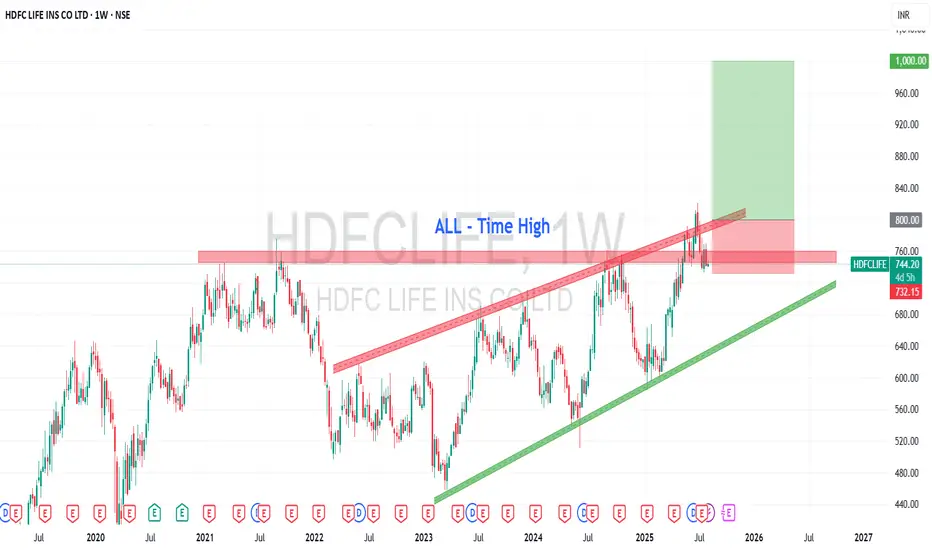
The stock had faced resistance in the ₹750–₹775 range since its all-time high in August 2021. In May 2025, this zone was decisively broken on expectations of a strong Q1 FY26—and Q1 results (announced 15 July) were indeed positive.
Now trading around ₹741, the breakout suggests renewed bullish momentum.
✅Bullish Setup: If the breakout level sustains and acts as support with confirmation from bullish candlestick patterns, we may see moves to:
🎯Target 1: ₹800
🎯Target 2: ₹900
🎯Target 3: ₹1,000
🚨Caution Levels:
Minor stop‑loss: ₹650
Major demand zone: ₹580
A drop below ₹700 undermines the bullish thesis, especially if ₹650 fails to hold and the major demand level is 580
💰Q1 FY26 Financial Highlights (vs Q4 FY25 & Q1 FY25)
- Total Income: ₹29,463 Cr (↑+22% vs ₹24,191 Cr; ↑+9.5% vs ₹26,934 Cr)
- Total Expenses: ₹29,024 Cr (↑+22% vs ₹23,814 Cr; ↑+9% vs ₹26,623 Cr)
- Operating Profits: ₹439 Cr (↑+16% vs ₹377 Cr; ↑+41% vs ₹311 Cr)
- Profit Before Tax: ₹604 Cr (↑+21% vs ₹500 Cr; ↑+51% vs ₹401 Cr)
- Profit After Tax: ₹548 Cr (↑+15% vs ₹475 Cr; ↑+14% vs ₹479 Cr)
- Diluted EPS: ₹2.54 (↑+15% vs ₹2.21; ↑+14% vs ₹2.23)
🧠Fundamental HighlightsProfit Growth: Q1 PAT rose ~14.4% YoY to ₹546 Cr on strong generation from back-book profits and expanded net premiums
Premium Momentum: Individual Annual Premium Equivalent (APE) grew ~12.5–16% YoY, signaling robust retail mix
New Business Value (VNB) estimate around ₹718–834 Cr, growing ~18% YoY
Balance Sheet Health: ROE steady at ~11.2%, D/E ratio approx. 0.18 — reflecting healthy capital structure
🎯Conclusion
HDFC Life has delivered a solid technical breakout, supported by encouraging Q1 financials and strong margin metrics. If the ₹750–₹775 zone now flips to support and holds, the stock could scale toward ₹1,000. However, under ₹650, caution is advised.
Disclaimer:lnkd.in/gJJDnvn2
Penafian
Maklumat dan penerbitan adalah tidak dimaksudkan untuk menjadi, dan tidak membentuk, nasihat untuk kewangan, pelaburan, perdagangan dan jenis-jenis lain atau cadangan yang dibekalkan atau disahkan oleh TradingView. Baca dengan lebih lanjut di Terma Penggunaan.
Penafian
Maklumat dan penerbitan adalah tidak dimaksudkan untuk menjadi, dan tidak membentuk, nasihat untuk kewangan, pelaburan, perdagangan dan jenis-jenis lain atau cadangan yang dibekalkan atau disahkan oleh TradingView. Baca dengan lebih lanjut di Terma Penggunaan.