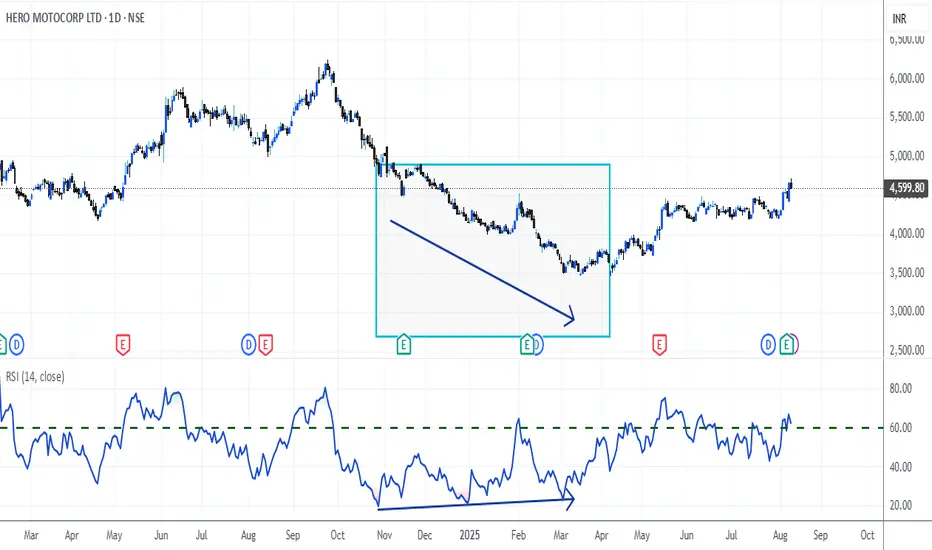
What is RSI Divergence?
RSI Divergence occurs when the price action and the RSI indicator move in opposite directions. It signals a potential trend reversal or correction. As shown in the chart, Clearly marked the real time scenario. Manipulation can be done in the prices but they cant manipulate RSI meter.
🔻 Types of RSI Divergence
1. Bullish Divergence
Price makes lower lows
RSI makes higher lows
🔁 Suggests weakening bearish momentum → potential upward reversal
2. Bearish Divergence
Price makes higher highs
RSI makes lower highs
🔁 Suggests weakening bullish momentum → potential downward reversal
Enhance your trading with simple concepts. Go deep not broad.
Penafian
Maklumat dan penerbitan adalah tidak dimaksudkan untuk menjadi, dan tidak membentuk, nasihat untuk kewangan, pelaburan, perdagangan dan jenis-jenis lain atau cadangan yang dibekalkan atau disahkan oleh TradingView. Baca dengan lebih lanjut di Terma Penggunaan.
Penafian
Maklumat dan penerbitan adalah tidak dimaksudkan untuk menjadi, dan tidak membentuk, nasihat untuk kewangan, pelaburan, perdagangan dan jenis-jenis lain atau cadangan yang dibekalkan atau disahkan oleh TradingView. Baca dengan lebih lanjut di Terma Penggunaan.
