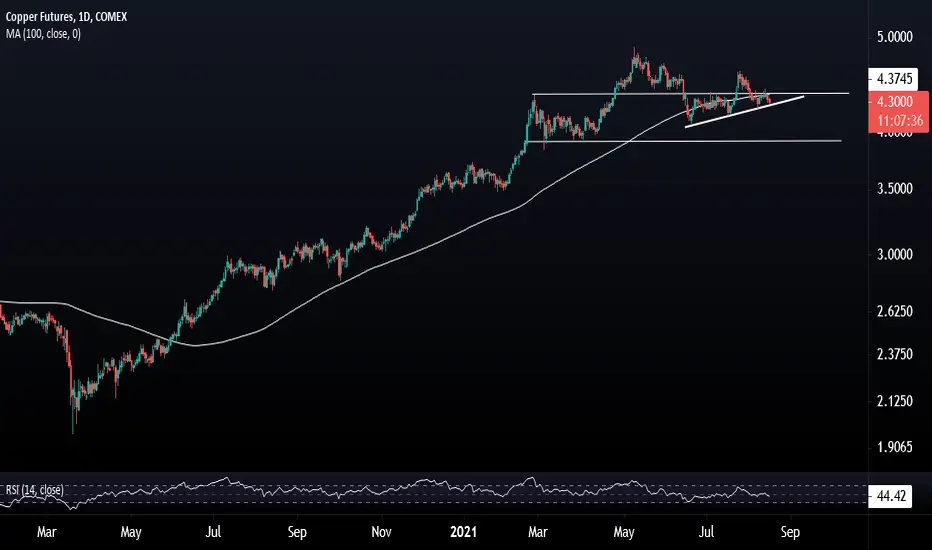
At $4.58 in May, amidst the commodities euphoria, I mentioned that investors should know when to 'get off the bus'. You may recall the monthly chart giving us a signal at $2.31 in May 2020.
Copper just so happen to make it's short term peak the following day with the price now below it's 21 & 50-EMA as well as it's 100-SMA. Caution if the short term incline is breached. 14-Day RSI at 44, a bearish trend.
Downside risk elevated below $4.23.
Current: $4.29
Copper just so happen to make it's short term peak the following day with the price now below it's 21 & 50-EMA as well as it's 100-SMA. Caution if the short term incline is breached. 14-Day RSI at 44, a bearish trend.
Downside risk elevated below $4.23.
Current: $4.29
Penafian
Maklumat dan penerbitan adalah tidak dimaksudkan untuk menjadi, dan tidak membentuk, nasihat untuk kewangan, pelaburan, perdagangan dan jenis-jenis lain atau cadangan yang dibekalkan atau disahkan oleh TradingView. Baca dengan lebih lanjut di Terma Penggunaan.
Penafian
Maklumat dan penerbitan adalah tidak dimaksudkan untuk menjadi, dan tidak membentuk, nasihat untuk kewangan, pelaburan, perdagangan dan jenis-jenis lain atau cadangan yang dibekalkan atau disahkan oleh TradingView. Baca dengan lebih lanjut di Terma Penggunaan.
