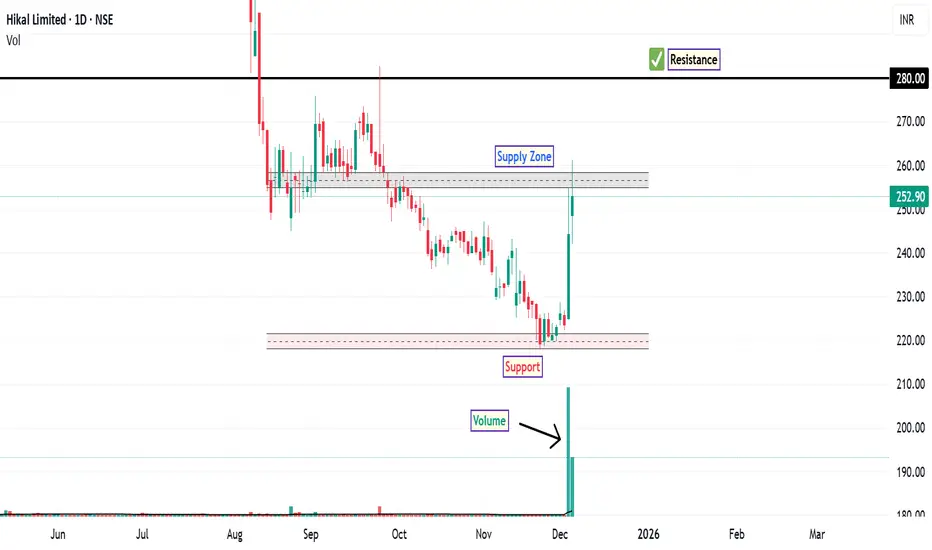
The stock of Hikal Ltd. experienced a significant breakdown below its major support level of ₹331 in July, marking a continuation of its bearish phase. After testing the discount zone which is now major support zone, the stock rebounded sharply with high trading volume, signaling renewed buying interest and possible accumulation.
A CHOCH pattern has been observed, which often suggests a shift from bearish to bullish structure when confirmed by price and volume behaviour. The stock has managed to close and sustain above the 50-day EMA, a key indicator of short-term trend strength and potential continuation of the uptrend.
The RSI is currently above 65, indicating strong bullish momentum and approaching overbought territory. A MACD bullish crossover along with a positive histogram further reinforces the upward bias.
Nearest Resistance: Around ₹280 (marked supply zone where selling pressure may emerge)
Support Zone: Below ₹217 (critical level for trend validation)
Intermediate Demand Zone: Recent breakout area near the 50-DEMA
Disclaimer: This analysis is intended for educational and informational purposes only. It does not constitute investment advice or a recommendation to buy, sell, or hold any financial instrument. Traders and investors should conduct independent research and consult a licensed financial advisor before making any decisions.
Penafian
Maklumat dan penerbitan adalah tidak bertujuan, dan tidak membentuk, nasihat atau cadangan kewangan, pelaburan, dagangan atau jenis lain yang diberikan atau disahkan oleh TradingView. Baca lebih dalam Terma Penggunaan.
Penafian
Maklumat dan penerbitan adalah tidak bertujuan, dan tidak membentuk, nasihat atau cadangan kewangan, pelaburan, dagangan atau jenis lain yang diberikan atau disahkan oleh TradingView. Baca lebih dalam Terma Penggunaan.