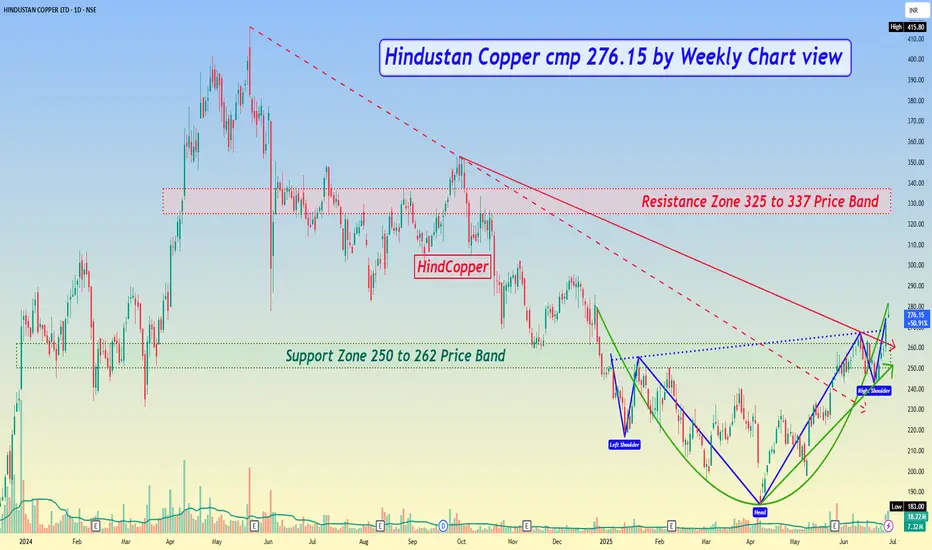
*Hindustan Copper cmp 276.15 by Weekly Chart view*
- Support Zone 250 to 262 Price Band
- Resistance Zone 325 to 337 Price Band
- All major Technical indicators BB, EMA, MACD, RSI trending positively
- Stock is seen trending with positive momentum on Daily and Weekly Charts
- Rising Support Trendline respected with Falling Resistance Trendline Breakout
- Bullish Head & Shoulders pattern within Bullish Rounding Bottom seen completed
- Volumes are getting attractive and spiking heavily above the average traded quantity
- Stock seems to have tested and retested the Support Zone and attempting upwards momentum
Penafian
Maklumat dan penerbitan adalah tidak dimaksudkan untuk menjadi, dan tidak membentuk, nasihat untuk kewangan, pelaburan, perdagangan dan jenis-jenis lain atau cadangan yang dibekalkan atau disahkan oleh TradingView. Baca dengan lebih lanjut di Terma Penggunaan.
Penafian
Maklumat dan penerbitan adalah tidak dimaksudkan untuk menjadi, dan tidak membentuk, nasihat untuk kewangan, pelaburan, perdagangan dan jenis-jenis lain atau cadangan yang dibekalkan atau disahkan oleh TradingView. Baca dengan lebih lanjut di Terma Penggunaan.