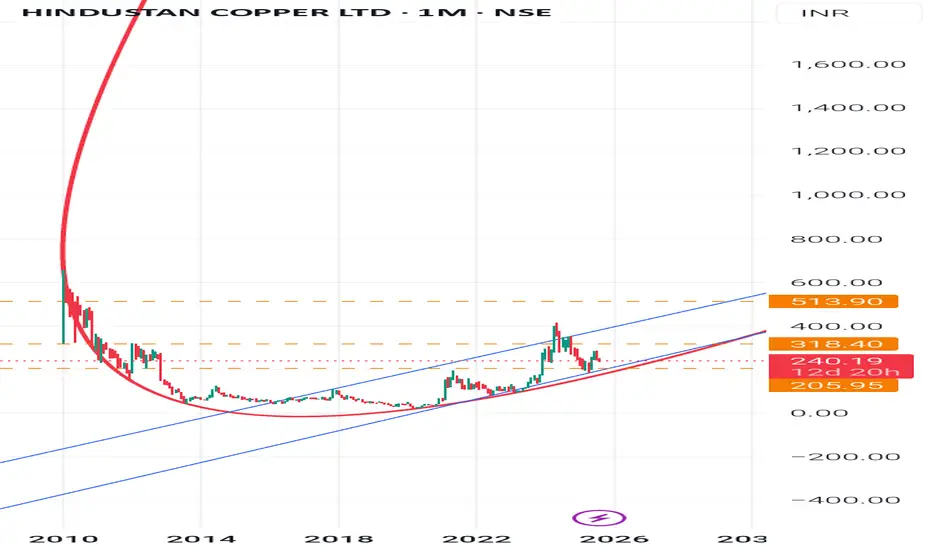
Hindustan Copper (HINDCOPPER)- Monthly Chart : Trend Analysis-
Long-term Trend: Strong uptrend since 2020, visible with higher highs and higher lows.
Current Position: After a sharp rally to 414, the stock corrected and is now consolidating around 280.
200-Month MA (red curve): Acts as a strong long-term support trendline.
Chart Pattern👉
Cup & Handle Formation: The stock formed a long cup (2010-2020) and has broken out. Now it is forming a handle/consolidation phase.
Rising Channel: Price is moving inside an upward channel (blue lines).
Support Levels
1. 240 - Strong immediate support (monthly close basis).
2. 205 - Next strong support (channel + trendline confluence).
3. 165- Major base (only if bigger correction comes).
📈 Resistance Levels
1. 318- First hurdle (recent swing high).
2. 414- Previous top, very important resistance.
3. 513- Long-term target zone shown on your chart.
🚀 Next Big Leap🎯
If stock sustains above 318, momentum buying can take it back toward 414.
A monthly close above 414 will confirm a fresh breakout, next big target opens to 513-550 zone.
In the longer run (2-3 years), if 513 is crossed and sustained, stock could head towards 750+.
Risk Note:
Below 240 on monthly close- weakness.
Below 205- trend reversal risk (long-term investors must watch this level closely).
Summary:
Hindustan Copper is in a long-term bullish structure. It is currently consolidating in a handle phase between 240-318. A breakout above 318 can lead to a retest of 414, and then a big move towards 513+. Long-term investors should stay put as long as 205 support holds.
Disclaimer-
This analysis is only for educational and learning purposes.
It is not an investment or trading advice.
Stock market investing is risky- please consult a SEBI-registered financial advisor before making any decisions.
#StockMarket #TechnicalAnalysis #PriceAction
Penerbitan berkaitan
Penafian
Maklumat dan penerbitan adalah tidak dimaksudkan untuk menjadi, dan tidak membentuk, nasihat untuk kewangan, pelaburan, perdagangan dan jenis-jenis lain atau cadangan yang dibekalkan atau disahkan oleh TradingView. Baca dengan lebih lanjut di Terma Penggunaan.
Penerbitan berkaitan
Penafian
Maklumat dan penerbitan adalah tidak dimaksudkan untuk menjadi, dan tidak membentuk, nasihat untuk kewangan, pelaburan, perdagangan dan jenis-jenis lain atau cadangan yang dibekalkan atau disahkan oleh TradingView. Baca dengan lebih lanjut di Terma Penggunaan.