📊 HINDUSTAN ZINC LTD (HINDZINC) – NSE | Daily Chart Analysis
📅 Date: May 30, 2025
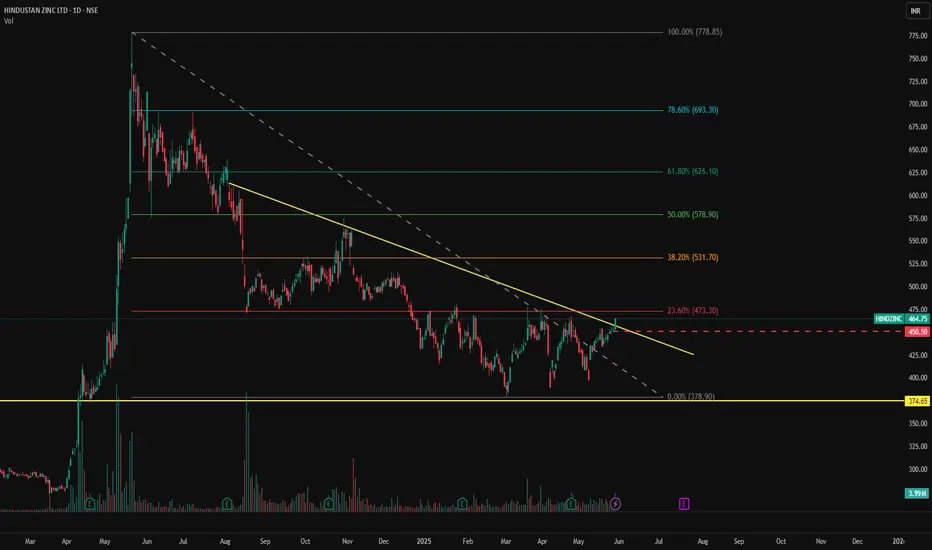
📈 CMP: ₹464.75 (+2.68%)
📌 Ticker: NSE:HINDZINC
🧠 Technical Breakdown
🟢 Descending Trendline Breakout 🟢
The stock is showing early signs of strength as it approaches the apex of a long-term descending trendline. Price action is attempting a trendline breakout from a nearly year-long downtrend, suggesting the possibility of a bullish reversal.
🔍 Volume Confirmation
Steady volume buildup over the past few sessions, potentially indicating accumulation ahead of a confirmed breakout.
📉 Well-Defined Support
₹374.65 has acted as a strong demand zone on multiple occasions, offering a solid base for the current move.
📍 Key Price Levels
🔺 Resistance (Trendline Breakout Zone): ₹465
🔻 Major Support: ₹374.65
🎯 Upside Targets (on breakout):
₹500
₹535
₹575+
🛡️ Stop Loss: Below ₹440 (on breakout failure)
📌 Trading Strategy
Aggressive Entry: On breakout + closing above ₹465 with volume surge
Conservative Entry: Retest of trendline post-breakout
SL: ₹440
Target Zone: ₹500–₹575
⚠️ Disclaimer
This post is for educational purposes only and does not constitute financial advice. Always conduct your own analysis or consult a financial advisor before investing.
📅 Date: May 30, 2025
📈 CMP: ₹464.75 (+2.68%)
📌 Ticker: NSE:HINDZINC
🧠 Technical Breakdown
🟢 Descending Trendline Breakout 🟢
The stock is showing early signs of strength as it approaches the apex of a long-term descending trendline. Price action is attempting a trendline breakout from a nearly year-long downtrend, suggesting the possibility of a bullish reversal.
🔍 Volume Confirmation
Steady volume buildup over the past few sessions, potentially indicating accumulation ahead of a confirmed breakout.
📉 Well-Defined Support
₹374.65 has acted as a strong demand zone on multiple occasions, offering a solid base for the current move.
📍 Key Price Levels
🔺 Resistance (Trendline Breakout Zone): ₹465
🔻 Major Support: ₹374.65
🎯 Upside Targets (on breakout):
₹500
₹535
₹575+
🛡️ Stop Loss: Below ₹440 (on breakout failure)
📌 Trading Strategy
Aggressive Entry: On breakout + closing above ₹465 with volume surge
Conservative Entry: Retest of trendline post-breakout
SL: ₹440
Target Zone: ₹500–₹575
⚠️ Disclaimer
This post is for educational purposes only and does not constitute financial advice. Always conduct your own analysis or consult a financial advisor before investing.
Dagangan ditutup: sasaran tercapai
The first resistance level has been touched. If the trend is to continue, it's important to follow a trailing stop-loss strategy and patiently wait for the price to approach the second resistance level.Penafian
The information and publications are not meant to be, and do not constitute, financial, investment, trading, or other types of advice or recommendations supplied or endorsed by TradingView. Read more in the Terms of Use.
Penafian
The information and publications are not meant to be, and do not constitute, financial, investment, trading, or other types of advice or recommendations supplied or endorsed by TradingView. Read more in the Terms of Use.