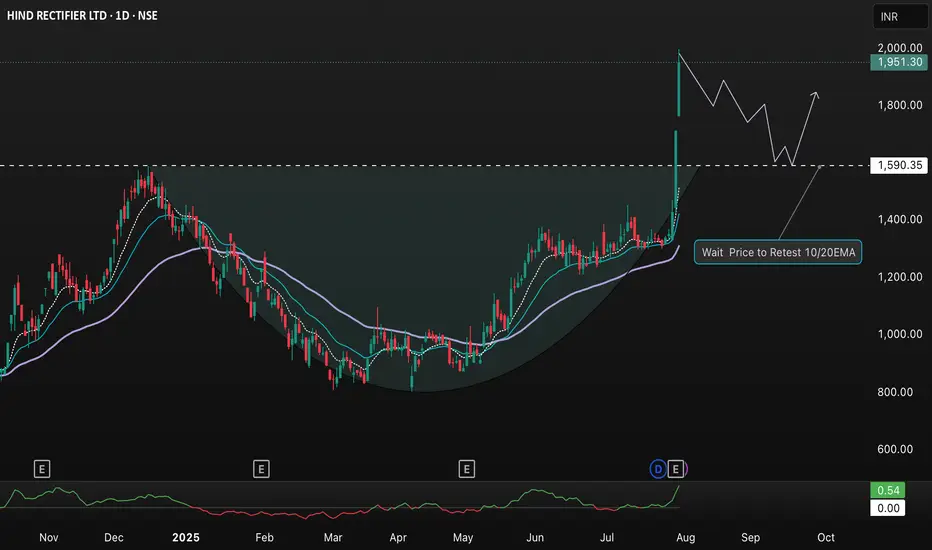
This chart for Hind Rectifiers Ltd (NSE: HIRECT) on the daily timeframe showcases a classic “Cup and Handle” breakout. After extended consolidation and base formation, price has surged above the 1,590 resistance, supported by strong volume and a rapid move to 1,951.30, reflecting a 13.96% single-day gain.
The annotation suggests waiting for a potential retest of the breakout zone (around 1,590) or the 10/20 EMA levels before considering entry. The projected path anticipates a period of consolidation or pullback, followed by a possible continuation to the upside. This setup highlights a bullish momentum with emphasis on risk management and optimal entry timing based on technical signals.
The annotation suggests waiting for a potential retest of the breakout zone (around 1,590) or the 10/20 EMA levels before considering entry. The projected path anticipates a period of consolidation or pullback, followed by a possible continuation to the upside. This setup highlights a bullish momentum with emphasis on risk management and optimal entry timing based on technical signals.
Penafian
Maklumat dan penerbitan adalah tidak dimaksudkan untuk menjadi, dan tidak membentuk, nasihat untuk kewangan, pelaburan, perdagangan dan jenis-jenis lain atau cadangan yang dibekalkan atau disahkan oleh TradingView. Baca dengan lebih lanjut di Terma Penggunaan.
Penafian
Maklumat dan penerbitan adalah tidak dimaksudkan untuk menjadi, dan tidak membentuk, nasihat untuk kewangan, pelaburan, perdagangan dan jenis-jenis lain atau cadangan yang dibekalkan atau disahkan oleh TradingView. Baca dengan lebih lanjut di Terma Penggunaan.
