Looking at the chart for Hup Seng Industries Berhad, here's my analysis:
Current Price Action:
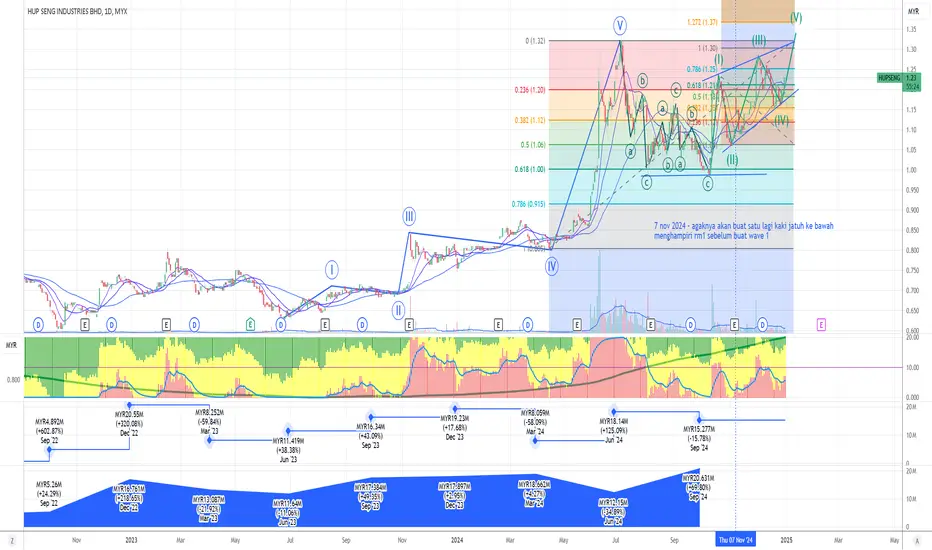
- Trading at RM0.780, up 1.96%
- Currently in an uptrend channel
- Price holding above key moving averages
Elliott Wave Analysis:
- Currently appears to be in Wave (IV) of a larger structure
- Previous waves (I), (II), and (III) clearly visible
- Potential for Wave (V) targeting RM1.37 (1.272 Fibonacci level)
Key Technical Levels:
1. Support:
- Strong support at RM0.915 (0.786 Fibonacci)
- Channel support around RM1.00
- Moving averages providing dynamic support
2. Resistance:
- RM1.20 (0.236 Fibonacci level)
- RM1.30 (previous high)
- Upper channel resistance around RM1.25
Pattern Analysis:
- Trading within an ascending channel
- Series of higher highs and higher lows
- ABC correction pattern visible within Wave (IV)
Volume Profile:
- Recent volume supporting the upward movement
- Money flow indicator showing accumulation
- Green volume bars indicating buying pressure
Notable Events:
- September 2024: MYR15.27M (-15.78%)
- Consistent recovery pattern since June 2023
p/s take profit first +-rm3180@27.46%
Current Price Action:
- Trading at RM0.780, up 1.96%
- Currently in an uptrend channel
- Price holding above key moving averages
Elliott Wave Analysis:
- Currently appears to be in Wave (IV) of a larger structure
- Previous waves (I), (II), and (III) clearly visible
- Potential for Wave (V) targeting RM1.37 (1.272 Fibonacci level)
Key Technical Levels:
1. Support:
- Strong support at RM0.915 (0.786 Fibonacci)
- Channel support around RM1.00
- Moving averages providing dynamic support
2. Resistance:
- RM1.20 (0.236 Fibonacci level)
- RM1.30 (previous high)
- Upper channel resistance around RM1.25
Pattern Analysis:
- Trading within an ascending channel
- Series of higher highs and higher lows
- ABC correction pattern visible within Wave (IV)
Volume Profile:
- Recent volume supporting the upward movement
- Money flow indicator showing accumulation
- Green volume bars indicating buying pressure
Notable Events:
- September 2024: MYR15.27M (-15.78%)
- Consistent recovery pattern since June 2023
p/s take profit first +-rm3180@27.46%
Penafian
Maklumat dan penerbitan adalah tidak dimaksudkan untuk menjadi, dan tidak membentuk, nasihat untuk kewangan, pelaburan, perdagangan dan jenis-jenis lain atau cadangan yang dibekalkan atau disahkan oleh TradingView. Baca dengan lebih lanjut di Terma Penggunaan.
Penafian
Maklumat dan penerbitan adalah tidak dimaksudkan untuk menjadi, dan tidak membentuk, nasihat untuk kewangan, pelaburan, perdagangan dan jenis-jenis lain atau cadangan yang dibekalkan atau disahkan oleh TradingView. Baca dengan lebih lanjut di Terma Penggunaan.