This is in the crytocurrency space and I am not familiar with this asset class. That is why I only advocate 1% of my capital for speculative trade.
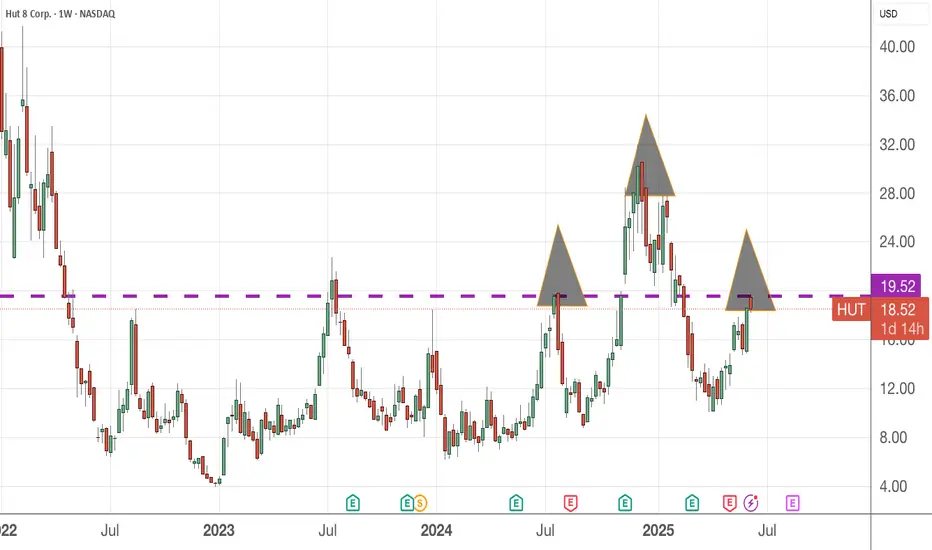
From the weekly chart, it appears a H&S pattern is formed and the dotted line represent the resistance level that the price action is attempting to break above since Aug 2022.
For those who bought at 24 price level, I guess your option is to wait out for it revisit this level or higher. And for those who wish to go LONG, wait for the breakout with a bullish sign first. Alternatively, seek for better asset class/companies to invest in.
Penafian
Maklumat dan penerbitan adalah tidak dimaksudkan untuk menjadi, dan tidak membentuk, nasihat untuk kewangan, pelaburan, perdagangan dan jenis-jenis lain atau cadangan yang dibekalkan atau disahkan oleh TradingView. Baca dengan lebih lanjut di Terma Penggunaan.
Penafian
Maklumat dan penerbitan adalah tidak dimaksudkan untuk menjadi, dan tidak membentuk, nasihat untuk kewangan, pelaburan, perdagangan dan jenis-jenis lain atau cadangan yang dibekalkan atau disahkan oleh TradingView. Baca dengan lebih lanjut di Terma Penggunaan.