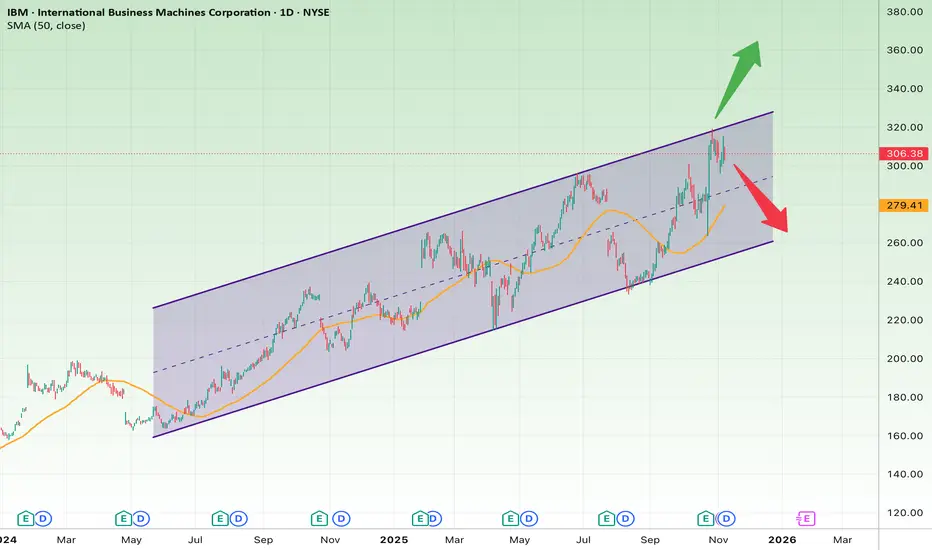
The daily chart of IBM shows a well-defined ascending channel that has been intact since around April 2024. The price is now testing the upper boundary of the channel, a crucial decision point that could lead either to a breakout continuation or a pullback toward support.
Short-Term Outlook (2–6 Weeks)
IBM is currently hovering around the 305–310 USD resistance zone, right near the top of its rising channel.
The 50-day SMA (~259 USD) is acting as dynamic support.
If price breaks above 310 USD with strong volume, a momentum rally could push toward 330–340 USD.
Bullish Scenario (short-term):
Entry: After a confirmed breakout above 310 USD
Target: 330 → 340 USD
Stop Loss: Below 295 USD
Bearish Scenario (short-term):
If IBM fails to break 310 and drops below 295, a correction toward the midline or the 50-day SMA is likely.
Target: 270 USD
Stop Loss: Above 310 USD
Long-Term Outlook (3–9 Months)
The broader trend remains bullish as long as the price stays within the ascending channel.
The channel floor around 250 USD is a key long-term support level.
If IBM successfully breaks and holds above the channel resistance (~310 USD), the next wave could extend toward 350–370 USD.
However, a breakdown below 250 USD would invalidate the bullish structure and may trigger a deeper retracement toward 220 USD.
Bullish Scenario (long-term):
Target: 350 → 370 USD
Stop Loss: 250 USD
Bearish Scenario (long-term):
Target: 220 USD
Stop Loss: 290 USD
Summary
IBM is at a critical turning point near the top of its long-term uptrend channel.
A breakout above 310 USD could ignite a strong rally toward 340–370 USD,
while failure to break resistance could lead to a short-term pullback to 270–250 USD.
Penafian
Maklumat dan penerbitan adalah tidak dimaksudkan untuk menjadi, dan tidak membentuk, nasihat untuk kewangan, pelaburan, perdagangan dan jenis-jenis lain atau cadangan yang dibekalkan atau disahkan oleh TradingView. Baca dengan lebih lanjut di Terma Penggunaan.
Penafian
Maklumat dan penerbitan adalah tidak dimaksudkan untuk menjadi, dan tidak membentuk, nasihat untuk kewangan, pelaburan, perdagangan dan jenis-jenis lain atau cadangan yang dibekalkan atau disahkan oleh TradingView. Baca dengan lebih lanjut di Terma Penggunaan.