📊 Daily Support & Resistance Levels
Support Levels:
S1: ₹91.43
S2: ₹90.93
S3: ₹90.14
S4: ₹88.93
Resistance Levels:
R1: ₹92.14
R2: ₹92.93
R3: ₹94.14
R4: ₹94.93
These levels are derived from standard pivot point calculations and serve as potential zones where price action may encounter support or resistance.
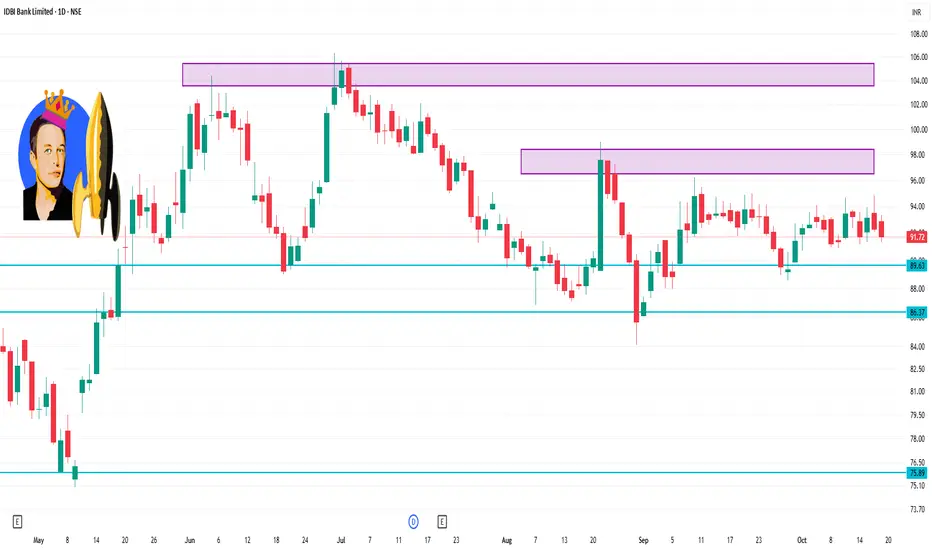
🔍 Current Price Action
Last Traded Price: ₹91.72 (as of October 17, 2025)
Recent Trend: The stock has been trading below the pivot point of ₹92.80, indicating a bearish short-term trend.
Key Levels to Watch:
Immediate Support: ₹91.69 (S1)
Immediate Resistance: ₹94.25 (R1)
Breakout Point: A move above ₹94.25 could signal a potential reversal to the upside.
Support Levels:
S1: ₹91.43
S2: ₹90.93
S3: ₹90.14
S4: ₹88.93
Resistance Levels:
R1: ₹92.14
R2: ₹92.93
R3: ₹94.14
R4: ₹94.93
These levels are derived from standard pivot point calculations and serve as potential zones where price action may encounter support or resistance.
🔍 Current Price Action
Last Traded Price: ₹91.72 (as of October 17, 2025)
Recent Trend: The stock has been trading below the pivot point of ₹92.80, indicating a bearish short-term trend.
Key Levels to Watch:
Immediate Support: ₹91.69 (S1)
Immediate Resistance: ₹94.25 (R1)
Breakout Point: A move above ₹94.25 could signal a potential reversal to the upside.
Penerbitan berkaitan
Penafian
Maklumat dan penerbitan adalah tidak dimaksudkan untuk menjadi, dan tidak membentuk, nasihat untuk kewangan, pelaburan, perdagangan dan jenis-jenis lain atau cadangan yang dibekalkan atau disahkan oleh TradingView. Baca dengan lebih lanjut di Terma Penggunaan.
Penerbitan berkaitan
Penafian
Maklumat dan penerbitan adalah tidak dimaksudkan untuk menjadi, dan tidak membentuk, nasihat untuk kewangan, pelaburan, perdagangan dan jenis-jenis lain atau cadangan yang dibekalkan atau disahkan oleh TradingView. Baca dengan lebih lanjut di Terma Penggunaan.