Panjang
IDEX Analysis
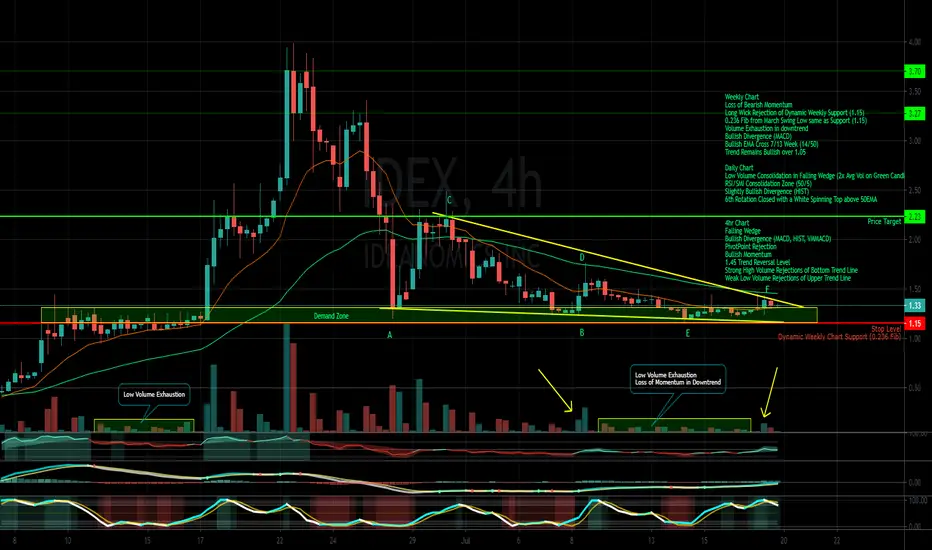
Weekly Chart
Loss of Bearish Momentum
Long Wick Rejection of Dynamic Weekly Support (1.15)
0.236 Fib from March Swing Low same as Support (1.15)
Volume Exhaustion in downtrend
Bullish Divergence (MACD)
Bullish EMA Cross 7/13 Week (14/50)
Trend Remains Bullish over 1.05
Daily Chart
Low Volume Consolidation in Falling Wedge (2x Avg Vol on Green Candles)
RSI/SMI Consolidation Zone (50/5)
Slightly Bullish Divergence (HIST)
6th Rotation Closed with a White Spinning Top above 50EMA
4hr Chart
Falling Wedge
Bullish Divergence (MACD, HIST, VMMACD)
PivotPoint Rejection
Bullish Momentum
1.45 Trend Reversal Level
Strong High Volume Rejections of Bottom Trend Line
Weak Low Volume Rejections of Upper Trend Line
Penafian
Maklumat dan penerbitan adalah tidak dimaksudkan untuk menjadi, dan tidak membentuk, nasihat untuk kewangan, pelaburan, perdagangan dan jenis-jenis lain atau cadangan yang dibekalkan atau disahkan oleh TradingView. Baca dengan lebih lanjut di Terma Penggunaan.
Penafian
Maklumat dan penerbitan adalah tidak dimaksudkan untuk menjadi, dan tidak membentuk, nasihat untuk kewangan, pelaburan, perdagangan dan jenis-jenis lain atau cadangan yang dibekalkan atau disahkan oleh TradingView. Baca dengan lebih lanjut di Terma Penggunaan.