Technical Overview:
Overall Signal: Strong Buy
Moving Averages: All moving averages (5, 10, 20, 50, 100, 200) are indicating a Buy signal.
RSI (14): 90.29 – Overbought (indicates strong upward momentum)
MACD: 24.38 – Positive (supports bullish trend)
Stochastic RSI: 95.20 – Overbought (suggests potential for a pullback)
CCI (14): 194.96 – Positive (indicates strong trend strength)
ADX (14): 35.55 – Strong trend (above 25 indicates a strong trend)
ATR (14): 14.44 – High volatility (indicates significant price movement)
Pivot Points:
Resistance Levels: R1: ₹565.46, R2: ₹570.23, R3: ₹577.96
Support Levels: S1: ₹552.96, S2: ₹545.23, S3: ₹540.46
Price Action:
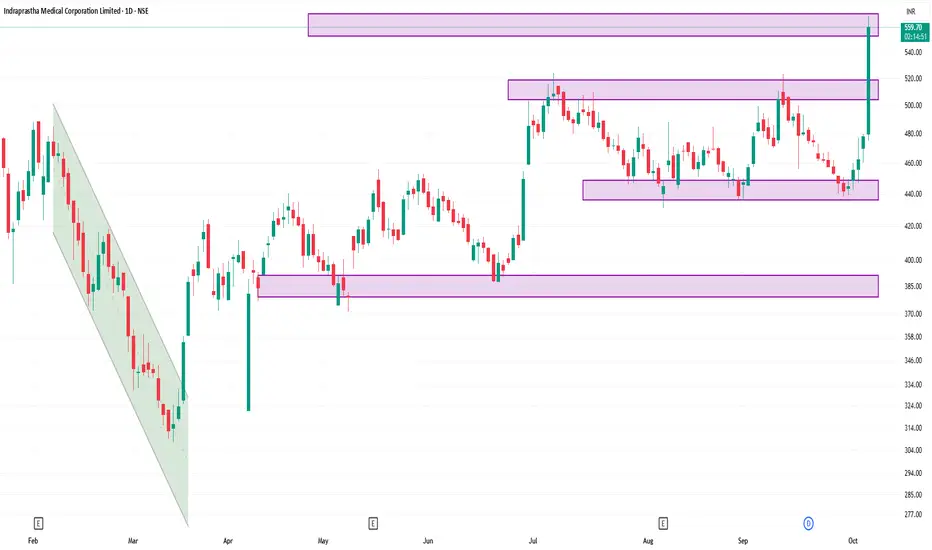
Current Price: ₹559.50
Day Range: ₹475.00 – ₹568.90
Previous Close: ₹478.10
Volume: Approximately 4.5 million shares traded
VWAP: ₹541.59
52-Week High/Low: ₹572.00 / ₹307.25
Summary:
The stock is currently trading near its 52-week high, indicating strong investor confidence. Technical indicators suggest a robust bullish trend, though the overbought conditions (RSI and Stochastic RSI) may imply a potential short-term pullback. Traders should monitor for any signs of reversal or consolidation near resistance levels.
Overall Signal: Strong Buy
Moving Averages: All moving averages (5, 10, 20, 50, 100, 200) are indicating a Buy signal.
RSI (14): 90.29 – Overbought (indicates strong upward momentum)
MACD: 24.38 – Positive (supports bullish trend)
Stochastic RSI: 95.20 – Overbought (suggests potential for a pullback)
CCI (14): 194.96 – Positive (indicates strong trend strength)
ADX (14): 35.55 – Strong trend (above 25 indicates a strong trend)
ATR (14): 14.44 – High volatility (indicates significant price movement)
Pivot Points:
Resistance Levels: R1: ₹565.46, R2: ₹570.23, R3: ₹577.96
Support Levels: S1: ₹552.96, S2: ₹545.23, S3: ₹540.46
Price Action:
Current Price: ₹559.50
Day Range: ₹475.00 – ₹568.90
Previous Close: ₹478.10
Volume: Approximately 4.5 million shares traded
VWAP: ₹541.59
52-Week High/Low: ₹572.00 / ₹307.25
Summary:
The stock is currently trading near its 52-week high, indicating strong investor confidence. Technical indicators suggest a robust bullish trend, though the overbought conditions (RSI and Stochastic RSI) may imply a potential short-term pullback. Traders should monitor for any signs of reversal or consolidation near resistance levels.
Penerbitan berkaitan
Penafian
Maklumat dan penerbitan adalah tidak bertujuan, dan tidak membentuk, nasihat atau cadangan kewangan, pelaburan, dagangan atau jenis lain yang diberikan atau disahkan oleh TradingView. Baca lebih dalam Terma Penggunaan.
Penerbitan berkaitan
Penafian
Maklumat dan penerbitan adalah tidak bertujuan, dan tidak membentuk, nasihat atau cadangan kewangan, pelaburan, dagangan atau jenis lain yang diberikan atau disahkan oleh TradingView. Baca lebih dalam Terma Penggunaan.