📈 Technical Overview (1-Day Timeframe)
Support & Resistance Levels
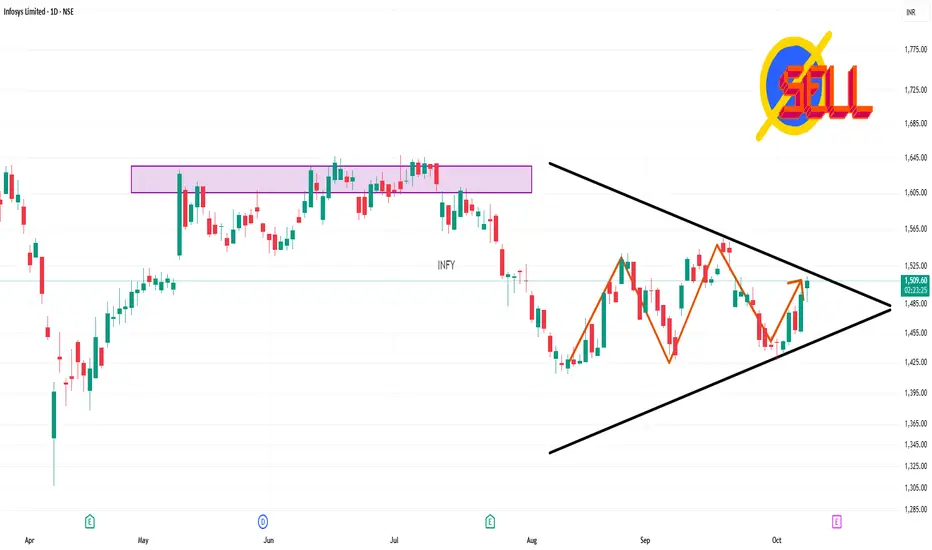
Immediate Support: ₹1,487.00
Immediate Resistance: ₹1,509.40
Pivot Point: ₹1,498.20
These levels are based on the current day's trading range and can serve as intraday reference points.
Moving Averages
5-Day: ₹1,453.10 (Buy)
10-Day: ₹1,463.10 (Sell)
20-Day: ₹1,491.33 (Sell)
50-Day: ₹1,480.74 (Sell)
100-Day: ₹1,534.03 (Sell)
200-Day: ₹1,614.71 (Sell)
The short-term moving averages indicate a bullish trend, while the longer-term averages suggest a bearish outlook.
Technical Indicators
Relative Strength Index (RSI): 43.75 — Neutral
Stochastic RSI: 25.04 — Neutral
MACD: -11.87 — Bearish
Rate of Change (ROC): -3.66 — Bearish
Commodity Channel Index (CCI): -63.85 — Neutral
These indicators suggest a neutral to slightly bearish momentum.
🔍 Market Sentiment
Infosys has become one of the most actively traded stocks today, particularly in call options, with significant volumes in various strike prices. The stock reached an intraday high, outperforming its sector. However, investor participation has declined, as evidenced by a notable drop in delivery volume.
⚠️ Summary
Infosys Ltd is currently experiencing a neutral to slightly bearish phase on the daily chart. While short-term support holds, the stock faces resistance near ₹1,509.40. Technical indicators like the MACD and ROC suggest downward momentum, and moving averages are predominantly signaling a sell. Traders should monitor the ₹1,509.40 resistance level closely; a breakout above this could shift the bias to bullish.
Support & Resistance Levels
Immediate Support: ₹1,487.00
Immediate Resistance: ₹1,509.40
Pivot Point: ₹1,498.20
These levels are based on the current day's trading range and can serve as intraday reference points.
Moving Averages
5-Day: ₹1,453.10 (Buy)
10-Day: ₹1,463.10 (Sell)
20-Day: ₹1,491.33 (Sell)
50-Day: ₹1,480.74 (Sell)
100-Day: ₹1,534.03 (Sell)
200-Day: ₹1,614.71 (Sell)
The short-term moving averages indicate a bullish trend, while the longer-term averages suggest a bearish outlook.
Technical Indicators
Relative Strength Index (RSI): 43.75 — Neutral
Stochastic RSI: 25.04 — Neutral
MACD: -11.87 — Bearish
Rate of Change (ROC): -3.66 — Bearish
Commodity Channel Index (CCI): -63.85 — Neutral
These indicators suggest a neutral to slightly bearish momentum.
🔍 Market Sentiment
Infosys has become one of the most actively traded stocks today, particularly in call options, with significant volumes in various strike prices. The stock reached an intraday high, outperforming its sector. However, investor participation has declined, as evidenced by a notable drop in delivery volume.
⚠️ Summary
Infosys Ltd is currently experiencing a neutral to slightly bearish phase on the daily chart. While short-term support holds, the stock faces resistance near ₹1,509.40. Technical indicators like the MACD and ROC suggest downward momentum, and moving averages are predominantly signaling a sell. Traders should monitor the ₹1,509.40 resistance level closely; a breakout above this could shift the bias to bullish.
Penerbitan berkaitan
Penafian
The information and publications are not meant to be, and do not constitute, financial, investment, trading, or other types of advice or recommendations supplied or endorsed by TradingView. Read more in the Terms of Use.
Penerbitan berkaitan
Penafian
The information and publications are not meant to be, and do not constitute, financial, investment, trading, or other types of advice or recommendations supplied or endorsed by TradingView. Read more in the Terms of Use.