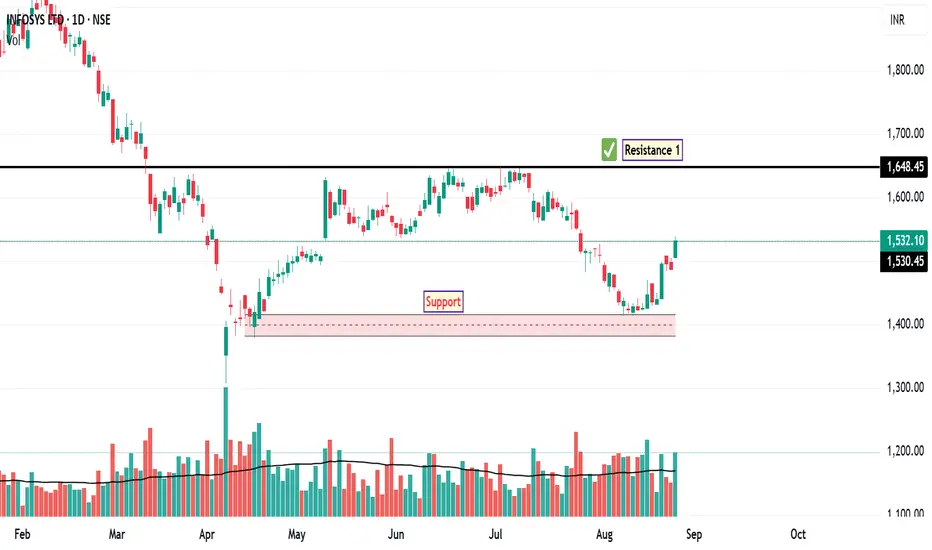
After experiencing a sustained downtrend since February 2025, Infosys has recently shown signs of a potential reversal on the daily chart. The stock has managed to close above its 50-day EMA, indicating a shift in short-term momentum and suggesting that buyers are beginning to regain control.
The RSI is currently hovering near the 60 level, which reflects improving bullish sentiment without yet entering overbought territory. This positioning often precedes further upside if supported by volume and price action.
Additionally, today's price action saw Infosys touch the upper Bollinger Band, a technical signal that often precedes a short-term pullback or consolidation. However, it can also indicate strong momentum if the price continues to ride the band. This move suggests a potential retest of the recent swing high near ₹1480.
From a structural standpoint, the next key resistance level is identified at ₹1648, which aligns with previous supply zones and Fibonacci retracement levels. On the downside, a logical stop-loss placement would be just below ₹1417, which serves as a near-term support and a level where the bullish structure would be invalidated if breached.
Disclaimer: This analysis is for educational and informational purposes only. It does not constitute investment advice or a recommendation to buy, sell, or hold any security. Always conduct your own research or consult a licensed financial advisor before making investment decisions.
Penafian
Maklumat dan penerbitan adalah tidak dimaksudkan untuk menjadi, dan tidak membentuk, nasihat untuk kewangan, pelaburan, perdagangan dan jenis-jenis lain atau cadangan yang dibekalkan atau disahkan oleh TradingView. Baca dengan lebih lanjut di Terma Penggunaan.
Penafian
Maklumat dan penerbitan adalah tidak dimaksudkan untuk menjadi, dan tidak membentuk, nasihat untuk kewangan, pelaburan, perdagangan dan jenis-jenis lain atau cadangan yang dibekalkan atau disahkan oleh TradingView. Baca dengan lebih lanjut di Terma Penggunaan.