Infosys (NSE: INFY) has been moving within a larger corrective structure after topping near ₹2006. The weekly Elliott Wave count suggests a possible W–X–Y correction, where the Y-leg may be unfolding as a 3-3-5 flat. With prices currently hovering in the mid-1500s, the bigger picture hints at unfinished business on the downside.
Weekly Chart – The Bigger Picture
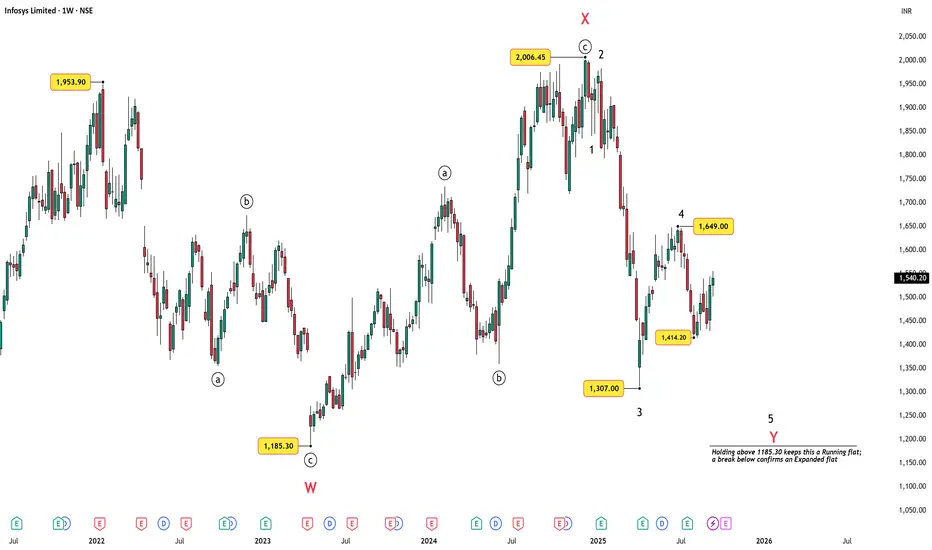
The weekly count shows:
Key levels to watch:
In simple terms: holding above ₹1185 keeps this a controlled correction, but breaking below it could mean a deeper and more extended decline.
Daily Chart – Zoomed In

On the daily timeframe, the larger Wave 4 looks complete near ₹1649. Infosys has since begun its Wave 5 decline. Within this drop, price found a low at ₹1414.20, which likely marks the end of a smaller Wave 3. The current bounce is best viewed as a smaller Wave 4 inside this ongoing Wave 5.
As long as the stock stays under 1649, the expectation is for Wave 5 to resume down, aligning with the weekly flat structure.
Summary & Key Levels
In short: 1649 is the bearish invalidation, 1414.20 is the immediate watch level, and 1185 is the big-picture decider.
Disclaimer: This analysis is for educational purposes only and does not constitute investment advice. Please do your own research (DYOR) before making any trading decisions.
Weekly Chart – The Bigger Picture
The weekly count shows:
- Wave W completed near ₹1185,
- A strong bounce into Wave X topping at ₹2006,
- And now Wave Y in play, potentially forming a flat correction.
Key levels to watch:
- ₹1307 – the low of Wave 3, which remains the immediate bearish target.
- ₹1185 – the critical level that decides whether this becomes a Running Flat (if held) or an Expanded Flat (if broken).
In simple terms: holding above ₹1185 keeps this a controlled correction, but breaking below it could mean a deeper and more extended decline.
Fundamental Note – U.S. H-1B Visa Shock
Adding to the technical picture, fundamentals just turned heavy. Infosys ADR fell nearly 4% on Friday-Sep 19, after U.S. President signed an executive order imposing a $100,000 fee on new H-1B visa petitions.
Since North America contributes one-third to two-thirds of Indian IT revenues, this sudden spike in visa costs introduces a policy headwind. While not an existential threat, it raises uncertainty for future growth and could act as a catalyst for the bearish structures already visible on the charts.
News source: in.tradingview.com/news/cnbctv:4247a275b094b:0/
Daily Chart – Zoomed In
On the daily timeframe, the larger Wave 4 looks complete near ₹1649. Infosys has since begun its Wave 5 decline. Within this drop, price found a low at ₹1414.20, which likely marks the end of a smaller Wave 3. The current bounce is best viewed as a smaller Wave 4 inside this ongoing Wave 5.
- Price is still capped below the SMA100 and SMA200, both acting as strong resistance.
- RSI at ~58 shows mid-range momentum, leaving room for the final Wave 5 leg to extend lower.
- The key structural invalidation remains ₹1649. Any sustained move above this level would negate the bearish count.
As long as the stock stays under 1649, the expectation is for Wave 5 to resume down, aligning with the weekly flat structure.
Summary & Key Levels
- The weekly and daily charts together point to a bearish bias in Infosys. The larger corrective W–X–Y flat is still in play, and the stock has already rolled into Wave 5 down.
- Short-term: A smaller Wave 4 bounce is underway, but unless price clears ₹1649, the expectation is for a continuation lower.
- Medium-term: A retest of ₹1414.20 is likely, with scope for an extension toward ₹1307.
- Long-term pivot: Holding above ₹1185 keeps the structure a Running Flat; a break below it would confirm an Expanded Flat.
In short: 1649 is the bearish invalidation, 1414.20 is the immediate watch level, and 1185 is the big-picture decider.
Disclaimer: This analysis is for educational purposes only and does not constitute investment advice. Please do your own research (DYOR) before making any trading decisions.
WaveXplorer | Elliott Wave insights
📊 X profile: @veerappa89
📊 X profile: @veerappa89
Penerbitan berkaitan
Penafian
Maklumat dan penerbitan adalah tidak dimaksudkan untuk menjadi, dan tidak membentuk, nasihat untuk kewangan, pelaburan, perdagangan dan jenis-jenis lain atau cadangan yang dibekalkan atau disahkan oleh TradingView. Baca dengan lebih lanjut di Terma Penggunaan.