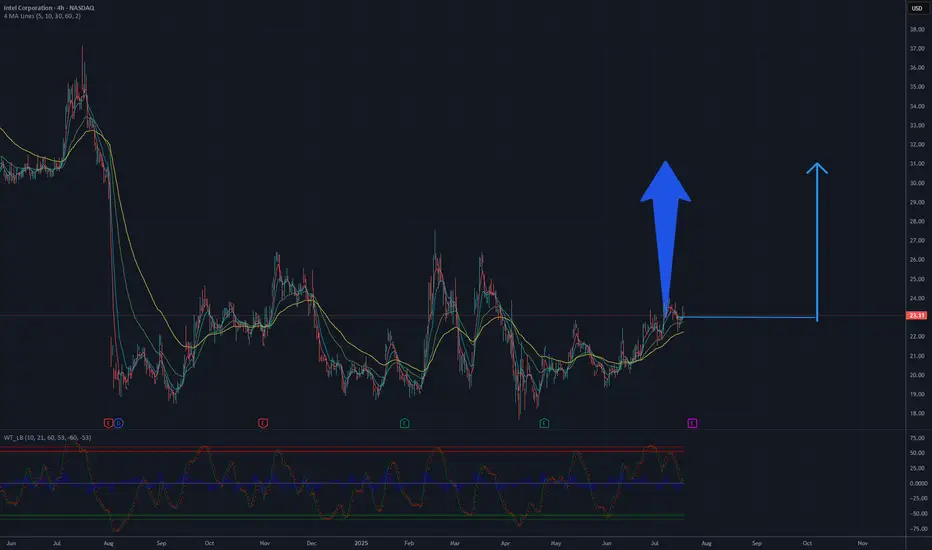
The Intel Corporation (INTC) chart on NASDAQ illustrates the stock price dynamics from 2024 to July 2025. Initially, the price rose to a peak in the first half of 2024, followed by a significant decline, reaching its lowest point around 24 USD by the end of 2024. Since then, the price has been consolidating in the 24-26 USD range, which may signal preparation for a potential rebound.
The moving averages (MA) on the chart suggest a gradual convergence of lines, indicating a possible turning point. Oscillators at the bottom of the chart, such as RSI, may indicate oversold conditions, supporting the hypothesis of an upward move. The 26 USD level acts as a strong support, and breaking above 28-30 USD could pave the way to 34 USD, a previous resistance level.
A potential rise to 34 USD is plausible if the price maintains momentum and breaks through the resistance with sufficient volume.
Potential TP: 32 USD
Dagangan ditutup: sasaran tercapai
Target done !! Penafian
Maklumat dan penerbitan adalah tidak dimaksudkan untuk menjadi, dan tidak membentuk, nasihat untuk kewangan, pelaburan, perdagangan dan jenis-jenis lain atau cadangan yang dibekalkan atau disahkan oleh TradingView. Baca dengan lebih lanjut di Terma Penggunaan.
Penafian
Maklumat dan penerbitan adalah tidak dimaksudkan untuk menjadi, dan tidak membentuk, nasihat untuk kewangan, pelaburan, perdagangan dan jenis-jenis lain atau cadangan yang dibekalkan atau disahkan oleh TradingView. Baca dengan lebih lanjut di Terma Penggunaan.