Panjang
IOSTBTC Fractal movement

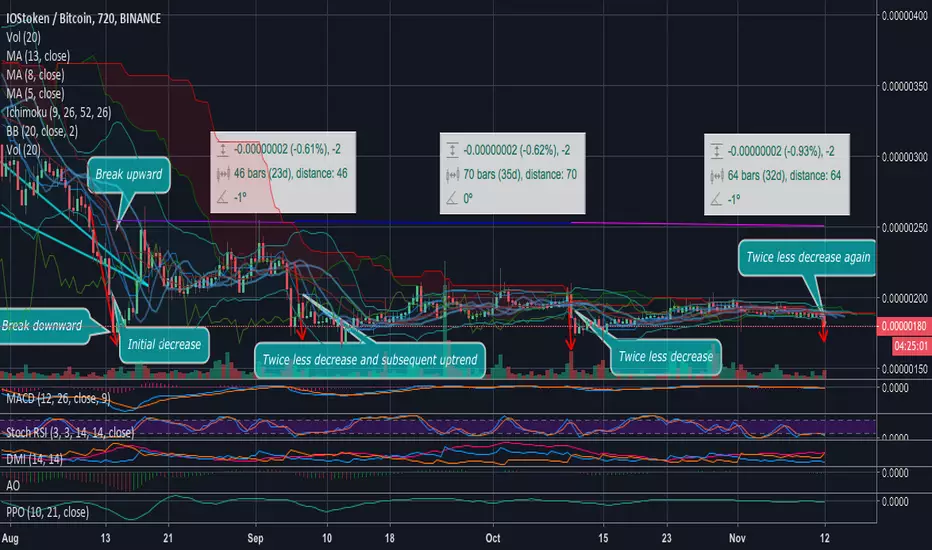
At the 12-hours timeframe chart we can observe 180 candles which equals to 90 days. Such frame can reveal patterns that the price movement repeats. One of them is a sharp decrease which becomes smaller and smaller time to time. It started after a double break of the descending triangle. The price can not consolidate: it either being pumped and moves lateral or goes sharply down.
We can observe an uptrend after each decrease which lasts at least 46 candles which equals to 23 days. According to Technical analysis indicators are bullish, while Stoch RSI is in the oversold zone and DMI suggest an upcoming volatility, while volume grows. These are elements of a strong basis for a trend reverse forecast for this coin
Carefully follow the targets in the signal to maximize profit from the price movement
Nota
The price finally reached our specified level and will now bounce up to the targetsClaim up to 600 USDT in welcome rewards & compete for a share of 5,000 USDT in BitMart Futures Contest!
➡ Register & Claim Bonus: bitmart.com/invite/VShg8M
➡ Join Contest: bitmart.com/futures-competition/Skyrexio/en-US
➡ Register & Claim Bonus: bitmart.com/invite/VShg8M
➡ Join Contest: bitmart.com/futures-competition/Skyrexio/en-US
Penafian
Maklumat dan penerbitan adalah tidak dimaksudkan untuk menjadi, dan tidak membentuk, nasihat untuk kewangan, pelaburan, perdagangan dan jenis-jenis lain atau cadangan yang dibekalkan atau disahkan oleh TradingView. Baca dengan lebih lanjut di Terma Penggunaan.
Claim up to 600 USDT in welcome rewards & compete for a share of 5,000 USDT in BitMart Futures Contest!
➡ Register & Claim Bonus: bitmart.com/invite/VShg8M
➡ Join Contest: bitmart.com/futures-competition/Skyrexio/en-US
➡ Register & Claim Bonus: bitmart.com/invite/VShg8M
➡ Join Contest: bitmart.com/futures-competition/Skyrexio/en-US
Penafian
Maklumat dan penerbitan adalah tidak dimaksudkan untuk menjadi, dan tidak membentuk, nasihat untuk kewangan, pelaburan, perdagangan dan jenis-jenis lain atau cadangan yang dibekalkan atau disahkan oleh TradingView. Baca dengan lebih lanjut di Terma Penggunaan.