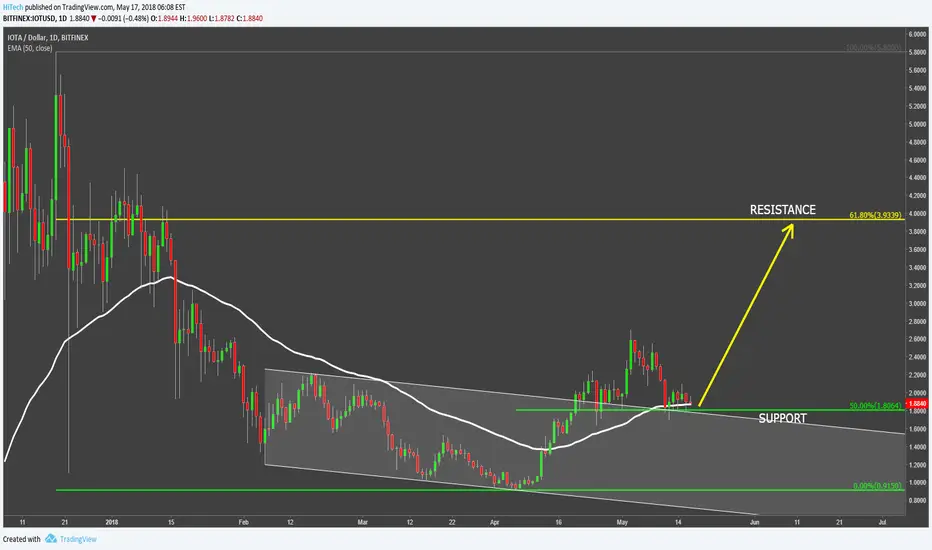
IOTA formed a bottom near $1 psychological support and price started to move up. IOT/USD broke above the 50 Moving Average followed by the breakout of the descending channel. Price has reached the high at $2.7 and corrected down.
The support has been found at 50% Fibonacci retracement level that is $1.8. At the same time IOTA is rejecting the 50 Moving Average and the upper trendline of the descending channel. If current support will continue to hold, price is likely to move higher, where the next resistance is seen at 61.8% Fibonacci retracement, that is $4 area.
On a downside, daily close below $1.7 is required in order to invalidate bullish outlook. In this case IOTA might go down, towards previous support area at $1
Nota
So far no daily close below the supportPenafian
Maklumat dan penerbitan adalah tidak dimaksudkan untuk menjadi, dan tidak membentuk, nasihat untuk kewangan, pelaburan, perdagangan dan jenis-jenis lain atau cadangan yang dibekalkan atau disahkan oleh TradingView. Baca dengan lebih lanjut di Terma Penggunaan.
Penafian
Maklumat dan penerbitan adalah tidak dimaksudkan untuk menjadi, dan tidak membentuk, nasihat untuk kewangan, pelaburan, perdagangan dan jenis-jenis lain atau cadangan yang dibekalkan atau disahkan oleh TradingView. Baca dengan lebih lanjut di Terma Penggunaan.
