---- Mid-term Analysis for the next coming 4 weeks to 3 months - Daily on Daily Chart (LOG)-------
IOTX/USDT: On Buying area, Direct rise expected
Context
- The Global Crypto market leads by BTC and ETH is still evolving within a bearish market configuration. Like the others digital assets IOTX suffered about negative global market situation
- However we are focus on a key buying area now on this coin and we expect a fast and quick recovery regarding technical element
Market configuration
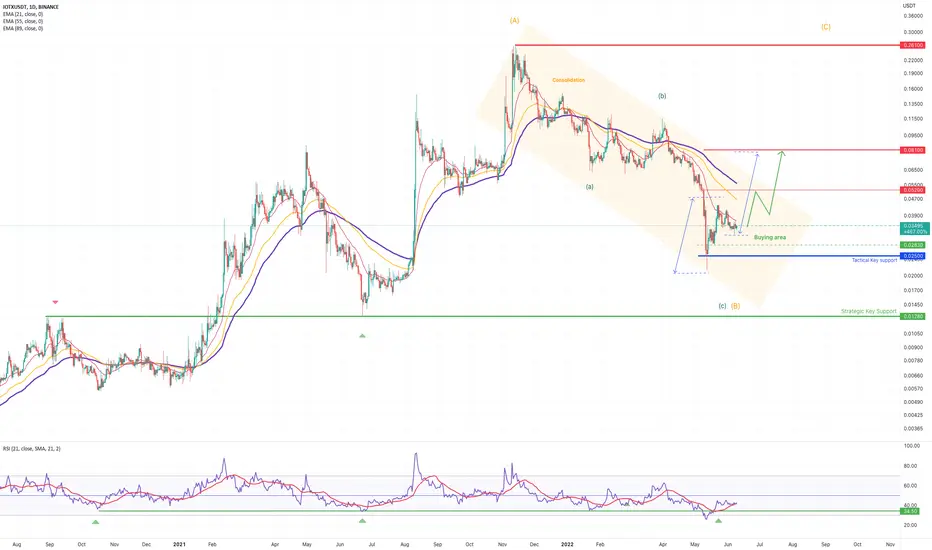
- Graphical Elements :
Graphical Resistance = 0,081 & 0,2610
Graphical Support = 0,025 & 0,01280
- Mathematical Indicators:
EMA ( Exp Moving averages) are still capping the market = Bearish
RSI indicator (below) is bouncing off key support = Bullish
- Elliot & Harmonic Wave (Fibonacci):
Fibonacci Target (c) (B) has been already reached = 0,2830
Fibonacci resistance of the wave in progress = 0, 052
Fibonacci support of the wave (c) (B) (max extension) = 0,01280
Fibonacci Bullish Target = 0,081 (auto-similar move)
Conclusion
Preferred case => Regarding the mid-term element, IOTX is offering the perfect entry area for a mid-term portfolio configuration in order to anticipate a bullish exit towards 0,052 and 0,081 as long as 0,025 remains support - In extension a larger rise towards the previous top at 0,2610 can't be ignored
IOTX/USDT: On Buying area, Direct rise expected
Context
- The Global Crypto market leads by BTC and ETH is still evolving within a bearish market configuration. Like the others digital assets IOTX suffered about negative global market situation
- However we are focus on a key buying area now on this coin and we expect a fast and quick recovery regarding technical element
Market configuration
- Graphical Elements :
Graphical Resistance = 0,081 & 0,2610
Graphical Support = 0,025 & 0,01280
- Mathematical Indicators:
EMA ( Exp Moving averages) are still capping the market = Bearish
RSI indicator (below) is bouncing off key support = Bullish
- Elliot & Harmonic Wave (Fibonacci):
Fibonacci Target (c) (B) has been already reached = 0,2830
Fibonacci resistance of the wave in progress = 0, 052
Fibonacci support of the wave (c) (B) (max extension) = 0,01280
Fibonacci Bullish Target = 0,081 (auto-similar move)
Conclusion
Preferred case => Regarding the mid-term element, IOTX is offering the perfect entry area for a mid-term portfolio configuration in order to anticipate a bullish exit towards 0,052 and 0,081 as long as 0,025 remains support - In extension a larger rise towards the previous top at 0,2610 can't be ignored
Dagangan aktif
Support tested - max excess tolerated at 0,021CIO & Head of market research (Automata - Vancelian)
vancelian.com/en
vancelian.com/en
Penafian
Maklumat dan penerbitan adalah tidak dimaksudkan untuk menjadi, dan tidak membentuk, nasihat untuk kewangan, pelaburan, perdagangan dan jenis-jenis lain atau cadangan yang dibekalkan atau disahkan oleh TradingView. Baca dengan lebih lanjut di Terma Penggunaan.
CIO & Head of market research (Automata - Vancelian)
vancelian.com/en
vancelian.com/en
Penafian
Maklumat dan penerbitan adalah tidak dimaksudkan untuk menjadi, dan tidak membentuk, nasihat untuk kewangan, pelaburan, perdagangan dan jenis-jenis lain atau cadangan yang dibekalkan atau disahkan oleh TradingView. Baca dengan lebih lanjut di Terma Penggunaan.