📈 Key Intraday Levels
Opening Price: ₹722.05
Day’s High: ₹724.85
Day’s Low: ₹714.60
Closing Price: ₹719.20
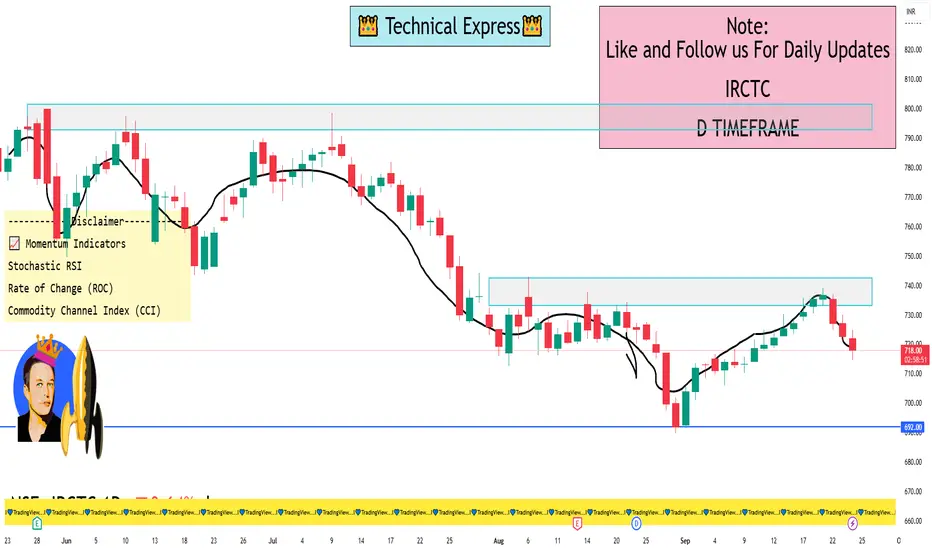
🔍 Technical Indicators
Support Level: ₹719.20 – This level is backed by accumulated volume, suggesting it may act as a reliable support point.
Resistance Level: ₹729.30 – The short-term moving average indicates this as a potential resistance point.
Volatility: The stock exhibited a 1.25% intraday range, with average daily volatility around 1.12%, indicating relatively stable movements.
📊 Momentum Indicators
Stochastic RSI: Currently in a neutral zone, suggesting neither overbought nor oversold conditions.
Rate of Change (ROC): Indicates a neutral condition, with no strong momentum in either direction.
Commodity Channel Index (CCI): Also in a neutral range, reflecting a lack of strong trend.
🛡️ Risk Management
Suggested Stop-Loss: ₹683.68 – Given the stock's low daily volatility, this stop-loss level offers a conservative risk management approach.
📌 Summary
IRCTC's stock is currently trading within a defined range, with support at ₹719.20 and resistance around ₹729.30. Momentum indicators suggest a neutral stance, indicating a wait-and-watch approach may be prudent for short-term traders. For those considering a longer-term perspective, the stock's low volatility and established support levels could present opportunities for accumulation, especially if it maintains above the ₹719.20 support.
Opening Price: ₹722.05
Day’s High: ₹724.85
Day’s Low: ₹714.60
Closing Price: ₹719.20
🔍 Technical Indicators
Support Level: ₹719.20 – This level is backed by accumulated volume, suggesting it may act as a reliable support point.
Resistance Level: ₹729.30 – The short-term moving average indicates this as a potential resistance point.
Volatility: The stock exhibited a 1.25% intraday range, with average daily volatility around 1.12%, indicating relatively stable movements.
📊 Momentum Indicators
Stochastic RSI: Currently in a neutral zone, suggesting neither overbought nor oversold conditions.
Rate of Change (ROC): Indicates a neutral condition, with no strong momentum in either direction.
Commodity Channel Index (CCI): Also in a neutral range, reflecting a lack of strong trend.
🛡️ Risk Management
Suggested Stop-Loss: ₹683.68 – Given the stock's low daily volatility, this stop-loss level offers a conservative risk management approach.
📌 Summary
IRCTC's stock is currently trading within a defined range, with support at ₹719.20 and resistance around ₹729.30. Momentum indicators suggest a neutral stance, indicating a wait-and-watch approach may be prudent for short-term traders. For those considering a longer-term perspective, the stock's low volatility and established support levels could present opportunities for accumulation, especially if it maintains above the ₹719.20 support.
I built a Buy & Sell Signal Indicator with 85% accuracy.
📈 Get access via DM or
WhatsApp: wa.link/d997q0
Contact - +91 76782 40962
| Email: techncialexpress@gmail.com
| Script Coder | Trader | Investor | From India
📈 Get access via DM or
WhatsApp: wa.link/d997q0
Contact - +91 76782 40962
| Email: techncialexpress@gmail.com
| Script Coder | Trader | Investor | From India
Penerbitan berkaitan
Penafian
Maklumat dan penerbitan adalah tidak bertujuan, dan tidak membentuk, nasihat atau cadangan kewangan, pelaburan, dagangan atau jenis lain yang diberikan atau disahkan oleh TradingView. Baca lebih dalam Terma Penggunaan.