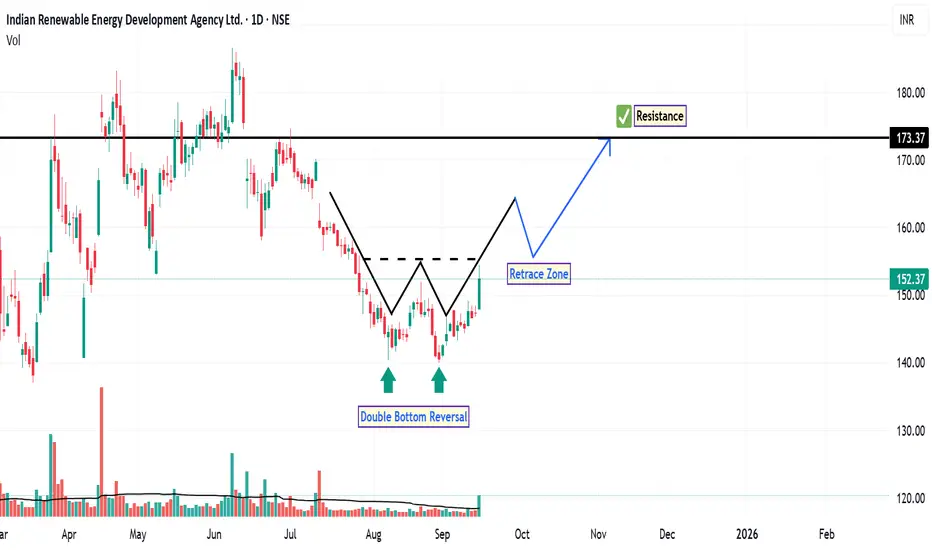
On the daily time frame, the chart of IREDA has recently displayed a double bottom reversal pattern, a classic technical formation often associated with a potential shift from bearish to bullish sentiment. This pattern, marked clearly on the chart, suggests that buyers may be stepping in at a previously defended price level.
In the preceding downtrend, the stock failed to establish a new low and instead broke above a prior swing high, indicating a CHoCH in market structure. This shift is typically interpreted by technical analysts as a transition from bearish to bullish momentum.
The RSI is currently above 60, approaching the overbought zone. While this suggests strong buying interest, it also warrants caution as price may be nearing short-term exhaustion. However, in trending markets, RSI can remain elevated for extended periods. Additionally, the stock has managed to close above both the 20-day and 50-day EMAs, accompanied by increased volume, which adds credibility to the bullish setup. These moving averages often act as dynamic support levels and trend confirmation tools.
Based on this technical structure, the next potential resistance levels are identified near ₹160, followed by ₹173. A technical stop-loss level could be considered at a daily close below ₹140, which aligns with the double bottom support zone.
Disclaimer: This analysis is intended solely for educational and informational purposes. It does not constitute investment advice or a recommendation to buy, sell, or hold any financial instrument. Market conditions are subject to change, and trading decisions should be made based on individual research, risk tolerance, and consultation with a licensed financial advisor.
Penafian
Maklumat dan penerbitan adalah tidak bertujuan, dan tidak membentuk, nasihat atau cadangan kewangan, pelaburan, dagangan atau jenis lain yang diberikan atau disahkan oleh TradingView. Baca lebih dalam Terma Penggunaan.
Penafian
Maklumat dan penerbitan adalah tidak bertujuan, dan tidak membentuk, nasihat atau cadangan kewangan, pelaburan, dagangan atau jenis lain yang diberikan atau disahkan oleh TradingView. Baca lebih dalam Terma Penggunaan.