History & Context:
Trade Setup:
Disclaimer: This is not financial advice and is for educational purposes only. Trading stocks involves risk, and you should carefully consider your risk tolerance and consult with a financial advisor before making any investment decisions. Past performance is not indicative of future results.
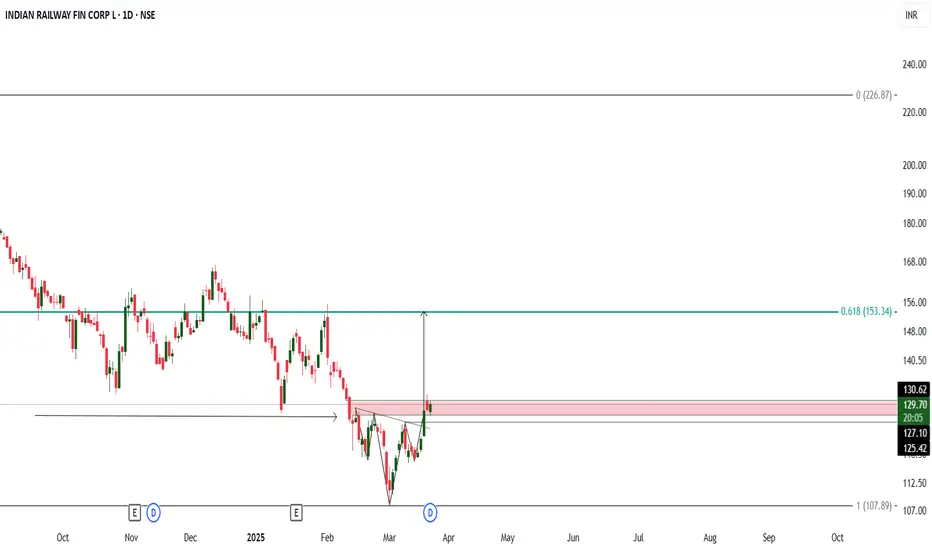
- Previous Decline: IRFC has fallen from its top of 227 to its bottom of 108, representing a 53% decline.
- Recovery: The stock has recovered 17% from its bottom, indicating some strength.
- Inverted Head and Shoulders: Over the past 22 days, the stock has formed an Inverted Head and Shoulders pattern, which typically signals accumulation at lower levels and potential reversal.
- Pattern Identification: The chart shows an Inverted Head and Shoulders pattern, suggesting a potential reversal from a downtrend to an uptrend.
- Breakout Point: The neckline is identified around 127.28, and a breakout above this level could confirm the pattern, signaling further upward movement.
- Price Target: The projected target based on the Inverted Head and Shoulders pattern is around 150.50, which aligns with the 61.8% retracement level.
- Stop Loss: A stop loss can be set below the right shoulder at 125.42, protecting against a potential reversal.
Trade Setup:
- Entry Point: Buy around 127.28 (Breakout of the neckline).
- Target Price: 150.50 (around 20% potential gain).
- Stop Loss: 125.42 (below the right shoulder).
Disclaimer: This is not financial advice and is for educational purposes only. Trading stocks involves risk, and you should carefully consider your risk tolerance and consult with a financial advisor before making any investment decisions. Past performance is not indicative of future results.
Penafian
Maklumat dan penerbitan adalah tidak dimaksudkan untuk menjadi, dan tidak membentuk, nasihat untuk kewangan, pelaburan, perdagangan dan jenis-jenis lain atau cadangan yang dibekalkan atau disahkan oleh TradingView. Baca dengan lebih lanjut di Terma Penggunaan.
Penafian
Maklumat dan penerbitan adalah tidak dimaksudkan untuk menjadi, dan tidak membentuk, nasihat untuk kewangan, pelaburan, perdagangan dan jenis-jenis lain atau cadangan yang dibekalkan atau disahkan oleh TradingView. Baca dengan lebih lanjut di Terma Penggunaan.