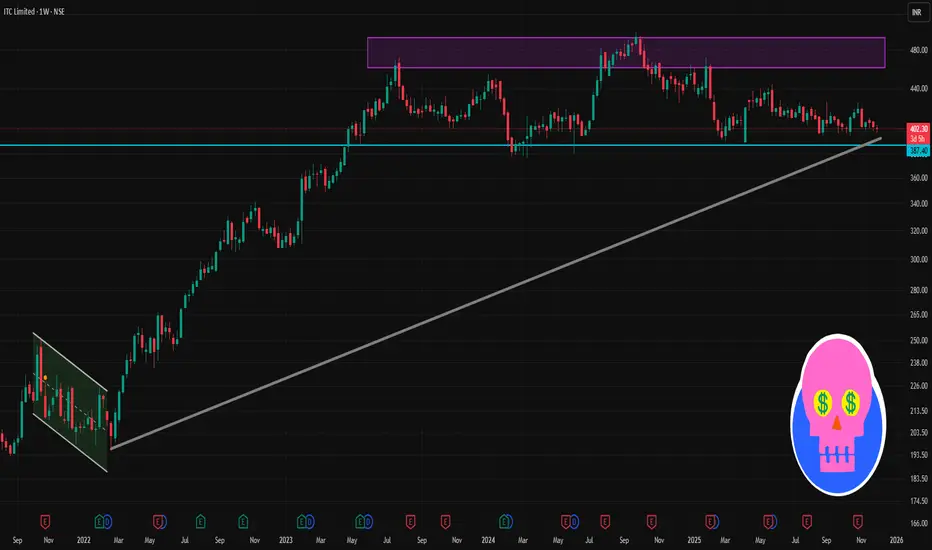
📈 Recent 1-Week Performance
Around Dec 2 2025, ITC is trading ~ ₹403–404.
Over last 1 week, the stock has moved up roughly +0.5 % to +0.6 % according to available weekly return data.
The 7-day exponential moving average (EMA) is also near ~₹402 — which suggests price is close to short-term average, not showing sharp divergence yet.
✅ What Price Action Would Suggest
If price holds above ₹402–403 and breaks above ₹405–407, that could indicate short-term bullish bias.
If price falls below ₹400, watch for possible further drop — support zone is ~₹398; a sharp break could shift short-term sentiment negative.
If price consolidates between ~₹402 and ~₹407, expect range-bound behaviour until a clear breakout or breakdown.
Penerbitan berkaitan
Penafian
Maklumat dan penerbitan adalah tidak bertujuan, dan tidak membentuk, nasihat atau cadangan kewangan, pelaburan, dagangan atau jenis lain yang diberikan atau disahkan oleh TradingView. Baca lebih dalam Terma Penggunaan.
Penerbitan berkaitan
Penafian
Maklumat dan penerbitan adalah tidak bertujuan, dan tidak membentuk, nasihat atau cadangan kewangan, pelaburan, dagangan atau jenis lain yang diberikan atau disahkan oleh TradingView. Baca lebih dalam Terma Penggunaan.