Stock Analysis: IZMO Ltd. based on the chart and fundamentals:
Technical & Chart Pattern Analysis (Weekly Chart)
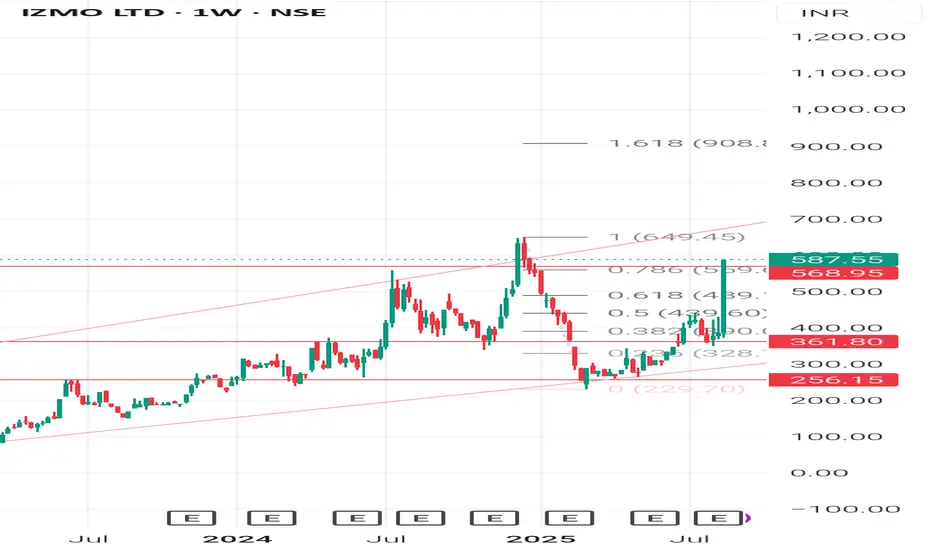
Current Price: 587.55 (+19.99% last move - strong momentum).
Fibonacci Levels (retracement from high):
0.382 - 390 (past support, now strong base).
0.5 - 439 (intermediate support).
0.618 - 499 (recent breakout level).
0.786 - 559 (crossed successfully).
1.0 - 649 (major resistance).
1.618 - 908 (next extended target).
Support Levels: 499 - 439 - 390.
Resistance Levels: 649 - 750 - 908.
Candlestick Pattern: Recent weekly candle is a strong bullish marubozu (no wick, full green), indicating aggressive buying and potential continuation of trend.
Swing Analysis: Stock bounced strongly from 256 (swing low) and has reclaimed key retracement levels, showing a trend reversal with momentum.
Chart Pattern:
Broke out of falling consolidation with volume.
Trading inside a long-term upward channel.
Target zones: 649 (supply zone) - If broken, 900 becomes visible.
Fundamental Snapshot - IZMO vs Competitors
Ratio / Metric IZMO Ltd. KPIT Tech Tata Elxsi
P/E (TTM) -23x -45x -65x
ROE -17% -20% -28%
Debt-to-Equity Low (<0.2) Low Low
Revenue Growth (YoY) Strong double-digit Moderate Stable
Market Cap -Small-cap Mid-cap Mid-cap/Large-cap
Learning: IZMO trades at a lower P/E compared to KPIT/Tata Elxsi, indicating undervaluation relative to peers if growth sustains. However, liquidity and volatility risk is higher since IZMO is a small-cap.
🎓 Student Learnings from This Chart
1. Fibonacci Retracement works well in identifying support/resistance during upswings.
2. Volume + bullish marubozu candles = trend confirmation.
3. Small-cap IT/auto-tech companies can give sharp rallies but also sharp corrections - risk management is critical.
4. Always compare fundamentals with peers - Lower P/E can mean undervaluation OR slower growth.
5. Invest gradually (SIP style) instead of chasing a rally after 20%+ up moves.
👉Disclaimer
This analysis is for educational purposes only. It is not investment advice. Stock markets are subject to risks. Please consult your financial advisor before investing.
#StockMarketIndia #TechnicalAnalysis #FundamentalAnalysis #SwingTrading #ChartPatterns #CandlestickPatterns #StudentInvestors #LongTermWealth #SmallCapStocks #InvestingBasics
Technical & Chart Pattern Analysis (Weekly Chart)
Current Price: 587.55 (+19.99% last move - strong momentum).
Fibonacci Levels (retracement from high):
0.382 - 390 (past support, now strong base).
0.5 - 439 (intermediate support).
0.618 - 499 (recent breakout level).
0.786 - 559 (crossed successfully).
1.0 - 649 (major resistance).
1.618 - 908 (next extended target).
Support Levels: 499 - 439 - 390.
Resistance Levels: 649 - 750 - 908.
Candlestick Pattern: Recent weekly candle is a strong bullish marubozu (no wick, full green), indicating aggressive buying and potential continuation of trend.
Swing Analysis: Stock bounced strongly from 256 (swing low) and has reclaimed key retracement levels, showing a trend reversal with momentum.
Chart Pattern:
Broke out of falling consolidation with volume.
Trading inside a long-term upward channel.
Target zones: 649 (supply zone) - If broken, 900 becomes visible.
Fundamental Snapshot - IZMO vs Competitors
Ratio / Metric IZMO Ltd. KPIT Tech Tata Elxsi
P/E (TTM) -23x -45x -65x
ROE -17% -20% -28%
Debt-to-Equity Low (<0.2) Low Low
Revenue Growth (YoY) Strong double-digit Moderate Stable
Market Cap -Small-cap Mid-cap Mid-cap/Large-cap
Learning: IZMO trades at a lower P/E compared to KPIT/Tata Elxsi, indicating undervaluation relative to peers if growth sustains. However, liquidity and volatility risk is higher since IZMO is a small-cap.
🎓 Student Learnings from This Chart
1. Fibonacci Retracement works well in identifying support/resistance during upswings.
2. Volume + bullish marubozu candles = trend confirmation.
3. Small-cap IT/auto-tech companies can give sharp rallies but also sharp corrections - risk management is critical.
4. Always compare fundamentals with peers - Lower P/E can mean undervaluation OR slower growth.
5. Invest gradually (SIP style) instead of chasing a rally after 20%+ up moves.
👉Disclaimer
This analysis is for educational purposes only. It is not investment advice. Stock markets are subject to risks. Please consult your financial advisor before investing.
#StockMarketIndia #TechnicalAnalysis #FundamentalAnalysis #SwingTrading #ChartPatterns #CandlestickPatterns #StudentInvestors #LongTermWealth #SmallCapStocks #InvestingBasics
Penerbitan berkaitan
Penafian
Maklumat dan penerbitan adalah tidak bertujuan, dan tidak membentuk, nasihat atau cadangan kewangan, pelaburan, dagangan atau jenis lain yang diberikan atau disahkan oleh TradingView. Baca lebih dalam Terma Penggunaan.
Penerbitan berkaitan
Penafian
Maklumat dan penerbitan adalah tidak bertujuan, dan tidak membentuk, nasihat atau cadangan kewangan, pelaburan, dagangan atau jenis lain yang diberikan atau disahkan oleh TradingView. Baca lebih dalam Terma Penggunaan.