The formation of a wedge pattern in the Japanese stock index has raised concerns among investors, as it often signals potential volatility and market correction.
A wedge pattern typically occurs when the price movement narrows between converging trend lines, indicating indecision among traders.
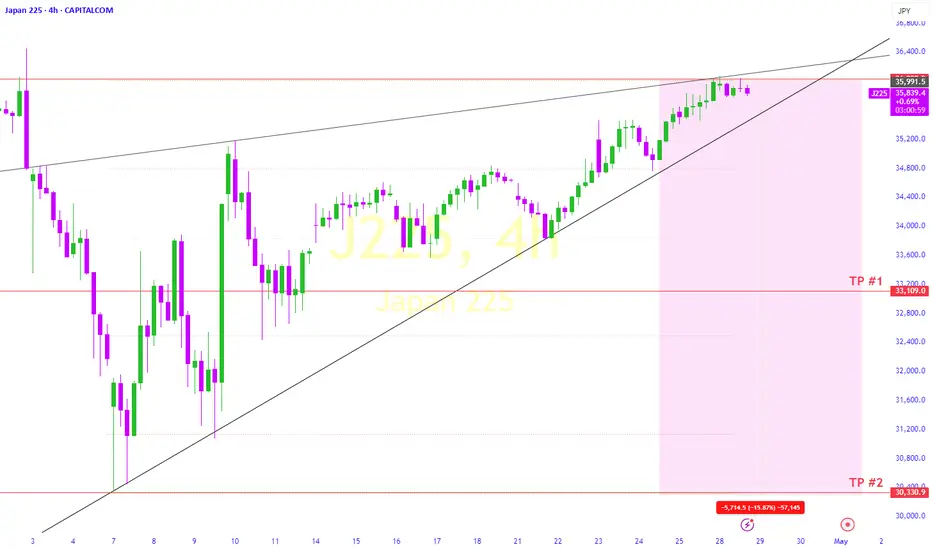
In the context of the Japanese stock market, this pattern can be particularly telling, as it suggests that the index may be reaching a critical juncture. Recent trends have shown a gradual decline in the index, which could lead to a significant downturn if the wedge breaks downward.
Investors should remain vigilant, as a sustained drop in the index could trigger broader market reactions and impact investor sentiment. Monitoring key economic indicators and geopolitical developments will be essential in navigating this precarious phase. As the situation unfolds, prudent risk management strategies will be vital for those looking to mitigate potential losses in a fluctuating market environment.
A wedge pattern typically occurs when the price movement narrows between converging trend lines, indicating indecision among traders.
In the context of the Japanese stock market, this pattern can be particularly telling, as it suggests that the index may be reaching a critical juncture. Recent trends have shown a gradual decline in the index, which could lead to a significant downturn if the wedge breaks downward.
Investors should remain vigilant, as a sustained drop in the index could trigger broader market reactions and impact investor sentiment. Monitoring key economic indicators and geopolitical developments will be essential in navigating this precarious phase. As the situation unfolds, prudent risk management strategies will be vital for those looking to mitigate potential losses in a fluctuating market environment.
Dagangan aktif
Bearish Butterfly Pattern Penafian
Maklumat dan penerbitan adalah tidak dimaksudkan untuk menjadi, dan tidak membentuk, nasihat untuk kewangan, pelaburan, perdagangan dan jenis-jenis lain atau cadangan yang dibekalkan atau disahkan oleh TradingView. Baca dengan lebih lanjut di Terma Penggunaan.
Penafian
Maklumat dan penerbitan adalah tidak dimaksudkan untuk menjadi, dan tidak membentuk, nasihat untuk kewangan, pelaburan, perdagangan dan jenis-jenis lain atau cadangan yang dibekalkan atau disahkan oleh TradingView. Baca dengan lebih lanjut di Terma Penggunaan.