Technical Analysis by Blaž Fabjan
Pattern Identification:
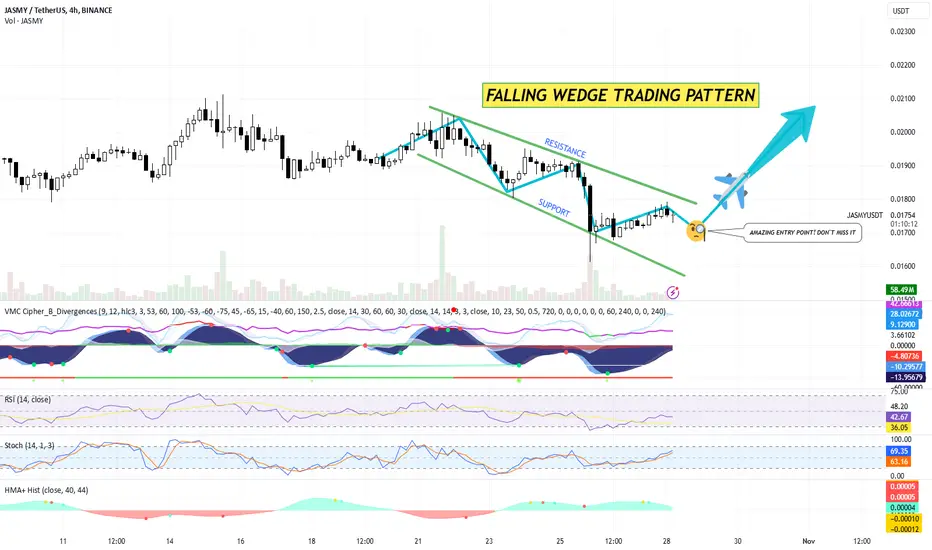
The chart displays a falling wedge pattern, a bullish reversal pattern often signifying a potential trend change from bearish to bullish.
The price action is currently testing the upper boundary of the wedge pattern, indicating that a breakout could be imminent if there’s sufficient buying momentum.
Support and Resistance:
Support Line: The lower green line in the falling wedge acts as support. This line has been consistently respected, indicating strong buying interest at those levels.
Resistance Line: The upper green line marks the resistance level within the pattern. A breakout above this line would be considered a strong bullish signal.
Volume Analysis:
There’s a noticeable decrease in volume within the wedge, which aligns with typical falling wedge characteristics. Look for a volume increase on a breakout to confirm the move.
Indicators:
VMC Cipher: Divergences and buy signals have been detected, showing signs of potential momentum shifts.
RSI: At around 41.07, the RSI is approaching the neutral zone (50), suggesting the potential for further upside if it breaks above 50.
Stochastic: Currently around 60.48, indicating upward momentum and possibly further bullish action if it continues moving up.
HMA+ Histogram: Showing minor bullish signals that could align with a breakout confirmation.
Entry Signal:
The wedge breakout zone is highlighted as an “Amazing Entry Point.” The suggested entry is around the resistance line in the pattern, currently close to $0.01743.
Trading Plan
Entry:
Enter a long position once JASMY/USDT breaks and closes above the falling wedge resistance line with increased volume. This would be near or slightly above the $0.0175 level, depending on price action confirmation.
Stop Loss:
Place a stop loss slightly below the wedge’s recent support level or just below the most recent swing low at around $0.016 to mitigate risk.
Take Profit Levels:
First Take Profit (TP1): Set around the recent swing high near $0.019.
Second Take Profit (TP2): For a more extended target, aim around $0.0205, where the price previously found resistance.
Final Take Profit (TP3): Around $0.022, aligning with previous higher resistance levels.
Risk Management:
Calculate position size to risk no more than 1-2% of your trading account per trade.
Monitor volume closely, as a breakout with low volume may indicate a false breakout, in which case exiting the trade early could be advisable.
Alternative Scenario:
If the price fails to break the resistance and moves back within the wedge, refrain from entering. In this case, wait for a possible retest of the support level around $0.016 as a secondary entry point.
Summary
Pattern: Falling Wedge (Bullish).
Buy Zone: Above $0.0175, confirmed with volume.
Stop Loss: Below $0.016.
Take Profit Targets: $0.019 (TP1), $0.0205 (TP2), $0.022 (TP3).
btw: VERY GOOD ENTRY POINT AT THE MOMENT!
Pattern Identification:
The chart displays a falling wedge pattern, a bullish reversal pattern often signifying a potential trend change from bearish to bullish.
The price action is currently testing the upper boundary of the wedge pattern, indicating that a breakout could be imminent if there’s sufficient buying momentum.
Support and Resistance:
Support Line: The lower green line in the falling wedge acts as support. This line has been consistently respected, indicating strong buying interest at those levels.
Resistance Line: The upper green line marks the resistance level within the pattern. A breakout above this line would be considered a strong bullish signal.
Volume Analysis:
There’s a noticeable decrease in volume within the wedge, which aligns with typical falling wedge characteristics. Look for a volume increase on a breakout to confirm the move.
Indicators:
VMC Cipher: Divergences and buy signals have been detected, showing signs of potential momentum shifts.
RSI: At around 41.07, the RSI is approaching the neutral zone (50), suggesting the potential for further upside if it breaks above 50.
Stochastic: Currently around 60.48, indicating upward momentum and possibly further bullish action if it continues moving up.
HMA+ Histogram: Showing minor bullish signals that could align with a breakout confirmation.
Entry Signal:
The wedge breakout zone is highlighted as an “Amazing Entry Point.” The suggested entry is around the resistance line in the pattern, currently close to $0.01743.
Trading Plan
Entry:
Enter a long position once JASMY/USDT breaks and closes above the falling wedge resistance line with increased volume. This would be near or slightly above the $0.0175 level, depending on price action confirmation.
Stop Loss:
Place a stop loss slightly below the wedge’s recent support level or just below the most recent swing low at around $0.016 to mitigate risk.
Take Profit Levels:
First Take Profit (TP1): Set around the recent swing high near $0.019.
Second Take Profit (TP2): For a more extended target, aim around $0.0205, where the price previously found resistance.
Final Take Profit (TP3): Around $0.022, aligning with previous higher resistance levels.
Risk Management:
Calculate position size to risk no more than 1-2% of your trading account per trade.
Monitor volume closely, as a breakout with low volume may indicate a false breakout, in which case exiting the trade early could be advisable.
Alternative Scenario:
If the price fails to break the resistance and moves back within the wedge, refrain from entering. In this case, wait for a possible retest of the support level around $0.016 as a secondary entry point.
Summary
Pattern: Falling Wedge (Bullish).
Buy Zone: Above $0.0175, confirmed with volume.
Stop Loss: Below $0.016.
Take Profit Targets: $0.019 (TP1), $0.0205 (TP2), $0.022 (TP3).
btw: VERY GOOD ENTRY POINT AT THE MOMENT!
Penafian
Maklumat dan penerbitan adalah tidak bertujuan, dan tidak membentuk, nasihat atau cadangan kewangan, pelaburan, dagangan atau jenis lain yang diberikan atau disahkan oleh TradingView. Baca lebih dalam Terma Penggunaan.
Penafian
Maklumat dan penerbitan adalah tidak bertujuan, dan tidak membentuk, nasihat atau cadangan kewangan, pelaburan, dagangan atau jenis lain yang diberikan atau disahkan oleh TradingView. Baca lebih dalam Terma Penggunaan.