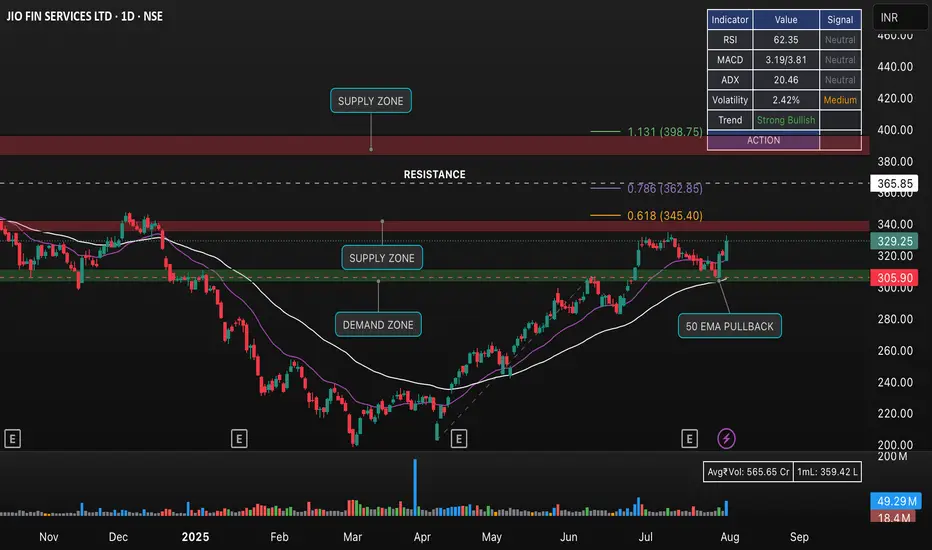
This daily chart of JIO FIN SERVICES LTD highlights the latest technical structure with a strong bullish trend. Key zones are marked:
• Supply Zones at 345–368 and 398–425 levels, where selling interest may emerge.
• Demand Zone at 285–310 levels, a potential support area.
• Fibonacci Levels: Price currently testing the 0.618 retracement at 345.40; next resistance at 0.786 (362.85).
• 50 EMA Pullback: Recent bounce from the 50 EMA, signaling buyer strength and a continuation potential.
• Key Resistance: 345–366 range is reinforced as a critical barrier.
• Indicators: RSI at 62, MACD and ADX neutral, volatility modest, trend marked “Strong Bullish.”
Watch for price action around supply/resistance zones and sustainability above 50 EMA for trend continuation or reversal signals. Suitable for short-term swing and positional traders watching breakout or pullback opportunities.
Penafian
Maklumat dan penerbitan adalah tidak dimaksudkan untuk menjadi, dan tidak membentuk, nasihat untuk kewangan, pelaburan, perdagangan dan jenis-jenis lain atau cadangan yang dibekalkan atau disahkan oleh TradingView. Baca dengan lebih lanjut di Terma Penggunaan.
Penafian
Maklumat dan penerbitan adalah tidak dimaksudkan untuk menjadi, dan tidak membentuk, nasihat untuk kewangan, pelaburan, perdagangan dan jenis-jenis lain atau cadangan yang dibekalkan atau disahkan oleh TradingView. Baca dengan lebih lanjut di Terma Penggunaan.